Loading [Contrib]/a11y/accessibility-menu.js
Loading [MathJax]/jax/output/SVG/jax.js
Budi, A. (2024). How Should Individual-Level Economic Voting Studies Measure Perceptions? A Meta-Analysis. Asian Journal for Public Opinion Research, 12(4), 214–242. https:/​/​doi.org/​10.15206/​ajpor.2024.12.4.214
Download all (7)
  • Figure 1. Forest Plot: Estimating Effects of the Overall Studies (see Appendix A for details)
  • Figure 2. Variation in Meta-Analysis Effect Size by Economic Voting Measures
  • Figure C1. Comparable Forest Plots Between Sociotropic (Left-Hand Side) and Pocketbook (Right-Hand Side) Based on Country and Time of the Studies
  • Figure D1. Funnel Plot of Publication Bias Diagnostics
  • Figure D2. Diagnostics for Influential Studies
  • Figure D3. Meta-Analysis Without Influential Estimates
  • Figure D4. Influential-Study Diagnostics Without Influential Estimates
  • 158 views
  • 24 pdf downloads

View more stats

Abstract

The literature on economic voting is vast. One of the primary debates is about how to measure economic performance as the central variable explaining incumbent survival. This paper offers a systematic examination of accumulated knowledge on economic voting and about different operationalizations of the key explanatory variable in individual-level economic voting studies. By investigating studies published in top-ranked journals and meta-analyzing the reported estimates, this paper finds that a sociotropic-retrospective measure, i.e., an individual’s perception of national economic conditions in the recent past, has a higher predictive power than other measures common in studies of economic voting. While a systematic meta-analysis has never been attempted using a large collection of works on individual-level economic voting studies, the findings also give us a strong reason to use sociotropic evaluation rather than pocketbook evaluation and more utilization of retrospective judgment than prospective. These other methods are also examined in the current article. This finding should help researchers choose measurement strategies in future studies.

The basic proposition of the vast literature on economic voting is that people reward or punish incumbent politicians based on economic performance. For decades, economic voting has been conceptually defined as people voting for incumbents (reward) as people positively perceive incumbents’ economic performance; or people vote for challengers (punish) as they are unsatisfied with incumbents’ performance (see, for instance, C. J. Anderson, 2007; Fiorina, 1978; Hellwig, 2012; Kramer, 1971; Lewis-Beck, 1997). Although scholars of economic voting have engaged with one another’s research, no one has yet systematically meta-analyzed accumulated knowledge in this area. Whether the effects of economic perceptions across individual-level studies converge or diverge is not known. This paper systematically investigates the extent to which voters’ perceptions of economic conditions have an effect on voting decisions based on the accumulated knowledge in the literature on economic voting. Additionally, it looks at how different measures of economic perceptions predict incumbents’ electoral fate.

Although a large number of studies on economic voting made use of macroeconomic data and actual voting outcomes, the center of gravity in the field has shifted to studies using individual-level survey data. Some argue that individual-level measures of perceived economic performance avoid the risk of ecological fallacy found in macro-level studies.[1] Within individual-level studies, scholars have been divided on how to best gauge economic performance under the incumbent. Following Fiorina’s pioneering work (Fiorina, 1978, 1981), supporters of a pocketbook measure suggest that evaluating personal economic conditions “inside” the household better predicts whether voters want to reward the incumbent with reelection or to punish their administration. On the other hand, starting from Kinder and Kiewet’s (1979; 1981) seminal works, proponents of sociotropic measures contend that gauging perceptions over general economic conditions (e.g., the national economy or surrounding businesses) is superior for investigating performance-based voting decisions. Some suggest that pocketbook and sociotropic perceptions are equally important (see Healy et al., 2017, p. 775).

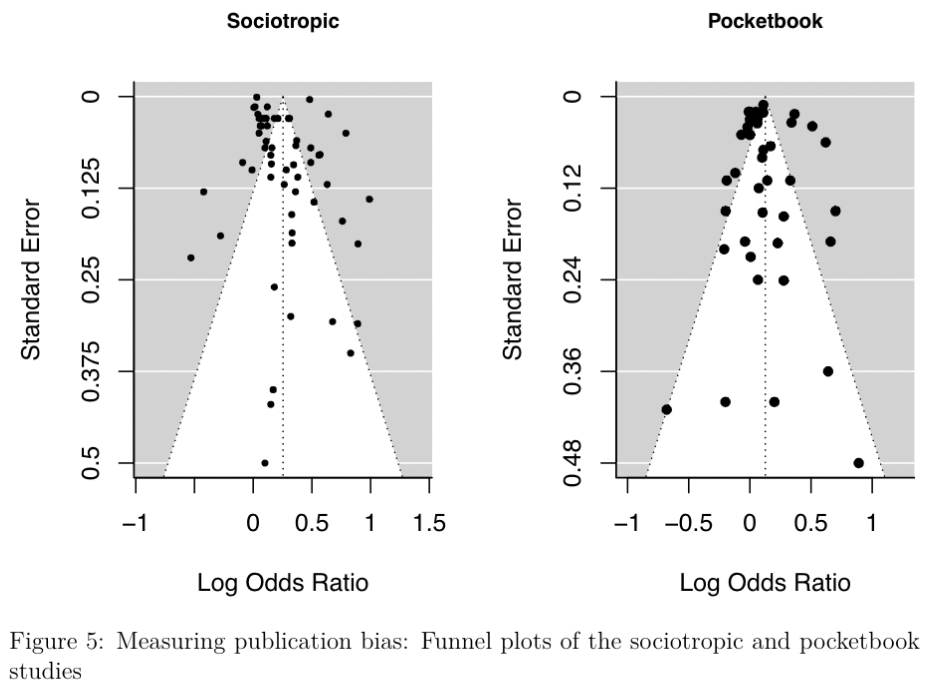
To summarize the central findings of the economic voting literature and to contribute to the debate about pocketbook versus sociotropic measures, I analyze 100 economic voting estimates published in eight top-ranked journals. This paper confirms that voters’ perceptions of economic conditions affect their preferences for the incumbent. Importantly, I show that perceptions of general economic conditions in the past (i.e., sociotropic-retrospective measures) have strong predictive power over voters’ voting decisions relative to other measures of economic perceptions. I do not find a significant publication bias in the metadata.

Methodological Debates

As “our understanding of economic voting depends crucially on the quality of available data” (Healy et al., 2017, p. 772), competing theoretical arguments in the study of individual-level economic voting partly stem from binary methodological debates, namely, between retrospective (the past) and prospective (the future) judgments; and between pocketbook (personal) and sociotropic (national) evaluations. Singer and Carlin (2013), nevertheless, provide evidence that both sociotropic and retrospective approaches are contextually dependent on prosperity while retrospective and prospective judgments temporally rely upon electoral cycles.[2] Thus, let’s trace back the principal premises of this debate and trajectory of this scholarship.

In his pioneering work on the retrospective thesis, Fiorina (1978, 1981) suggests that individual micro-level assessment of economic conditions explains support for the incumbent president by assessing voters’ past economic conditions. Subsequent authors (e.g., Conover & Feldman, 1986; Healy et al., 2017; Mutz & Mondak, 1997) then followed Fiorina’s basic question of the retrospective voting model. Meanwhile, in line with Kuklinski & West (1981), other works refer to the bankers’ analogy when voters use prospective judgment for their political decision in the election (Alt et al., 2016; MacKuen et al., 1992).[3]

In this respect, we might expect that both past economic evaluations and future predictions are dependent on the electoral cycle, given the fact that most citizens are poorly informed and unsophisticated (Barabas et al., 2014; Bullock et al., 2013; Bullock & Lenz, 2019; Converse, 1964/2006; Lane, 1962). During an electoral cycle, short-term evaluations (say, the last six-month period) might generate a so-called myopic judgment (Achen & Bartels, 2017) for the retrospective question but yields benefit for the prospective measure. In contrast, long-term evaluations (e.g., the last four-year period) situate a better retrospective study than prospective research. In this regard, both retrospective and prospective judgments might hypothetically generate indifferent predictive power for the mechanism of electoral accountability (i.e., incumbent’s electoral gain).

In the other area of debate, Fiorina’s (1978) survey has been one of the starting points of the pocketbook approach in order to complement the aggregate level studies conducted by Kramer (1971) and Tufte (1975). Some scholars follow Fiorina’s path.[4] Kuklinski and West argue that “economic voting implies a relationship between voters’ expected financial condition and their vote” (Kuklinski & West, 1981, p. 442). Conover and Feldman’s psychological assessment also supports the pocketbook measure, contending that “emotional reactions to personal economic condition influence political evaluations [and] personal well-being is important to understanding how people judge presidential and governmental performance” (Conover & Feldman, 1986, p. 75).

Meanwhile, the sociotropic thesis suggests that citizens evaluate national economic conditions relative to their financial situation when evaluating the incumbent or determining their vote choice (see Kinder & Kiewiet, 1981, p. 132).[5] As a pioneering work in this camp, Kinder and Kiewet (1979) only find two significant results across 11 surveys from 1956 to 1972; and five significant results from six surveys measuring sociotropic voting in 1962-1976. Mutz and Mondak’s (1997) group-level perceptions also basically support a sociotropic voting pattern, as the perceptions rely on collective evaluation and judgment. Others contend that “in the battle between the familiar pocketbook and sociotropic measures, now taken to the aggregate level, sociotropic wins: a president achieves greater popularity by having people think the economy is booming” (MacKuen et al., 1992, p. 602; see also, Klašnja et al., 2016; Lewis-Beck & Ratto, 2013).

Though there is a debate regarding whether sociotropic voting implies an altruistic attitude[6] due to the collective evaluation or a self-interested attitude because of the voters’ view of the national economy as a public good (Kinder & Kiewet, 1979; Kinder & Kiewiet, 1981; Kramer, 1983), proponents of the sociotropic approach argue that voters are not necessarily well informed and sophisticated since they simply “form impressions of how the economy performing […]” (Kinder & Kiewiet, 1981, p. 156). At this point, linking national or general economic conditions approximates the incumbent performance (Dassonneville & Lewis-Beck, 2014; Singer, 2011, 2013). This mechanism might drive us to expect that sociotropic perceptions have a stronger power to predict incumbent reelection than retrospective evaluation.

Correspondingly, debate of how to best reveal economic voting at individual-level studies has not been systematically examined. As the proponents of the competing measures evenly provide their justifying arguments, we need an empirical examination to observe whether one measure has a stronger predictive power on voting decision than the other. A meta-analysis is a one way to systematically quantify this accumulation of knowledge. This approach provides objective measures to assess the studies, rather than subjecting reasoning prevalent in the literature review (Ahmadov, 2014; Hunter et al., 1982). The following section describes the strategies employed to develop the metadata and analyses.

Data and Methods

Papers included in the meta-analysis are published in top-ranked peer-reviewed journals that commonly publish research on voting behavior. I use the top ten journals in the SCImago Journal Rank (SJR) and Google Scholar (GS) rankings. The use of SJR and GS as an entry procedure for journal selection provides a justifiable method to seek relevant articles in terms of publication time-span, scholarship engagement, and influence. Though it is not necessary that the analysis should address more or less than ten journals, the number of the selected journals is assumed to capture the journals that publish individual-level studies on economic voting over several decades. In SJR, I draw from the “Political Science and International Relations” category; the reported h-index captures the whole period of journal publication. In GS, the rankings come from the “Political Science” category, but the reported h-index only captures the period 2017-2021. As a result, the two rankings reveal different journals (see Table A1 in Appendix A). I only included studies that primarily investigate economic voting. Accordingly, I employed keywords strongly associated with this scholarship, including “economic voting,” “retrospective voting,” “sociotropic,” “pocketbook,” and unigrams of these phrases found in titles, abstracts, or keywords.

I found that only eight of the selected journals published relevant research, namely, American Journal of Political Science (AJPS), American Political Science Review (APSR), British Journal of Political Science (BJPS), The Journal of Politics (JOP), Comparative Political Studies (CPS), European Journal of Political Research (EJPR), Annual Review of Political Science (ARPS), and Political Psychology. I found 155 articles that broadly investigate economic rationales for voting decisions (the details are in Table A2 in Appendix A).

I then selected the papers that employed individual-level data, including any papers that employed both micro and macro-level data. Limiting the corpus to papers that explicitly measure economic perceptions, evaluations, or judgments, I ultimately found 41 eligible articles. In doing so, the selection procedure neglected distribution of geographical areas of economic voting studies covered in these articles. Yet, though economic voting theory stems from voting experiences in the United States, there is no criterion that omits studies from outside of the United States. Thus, several datasets covered in the selected articles come from developing democracies outside the United States, including some countries in Eastern Europe and Asia (see Appendix B). However, I acknowledge that an inability of the selection procedure to take regional variation of the meta-data into account is a limitation of this study.

In these studies, the estimates may come from a dichotomous measure of economic perceptions (bad or good) or an ordinal measure. The dependent variable may also be generated by a binary variable, i.e., whether the respondents said they would vote for the incumbent or not, or nominal variables, e.g., names of multiple candidates, found mostly in non-U.S. contexts (see, for example, Blais et al., 2004). Given the nature of the dependent variables, most authors employ logit or probit estimators. As normalizing the coefficients and creating a variance for each study is only feasible when the sample size and standard errors are provided (Fleiss & Berlin, 2019; Hunter et al., 1982), I exclude coefficients without reported standard errors. Unfortunately, some pioneering works (Fiorina, 1978; Kinder & Kiewet, 1979) do not report standard errors. These selection procedures returned 100 coefficients from 32 articles. Table A2 in Appendix A depicts the selection process.

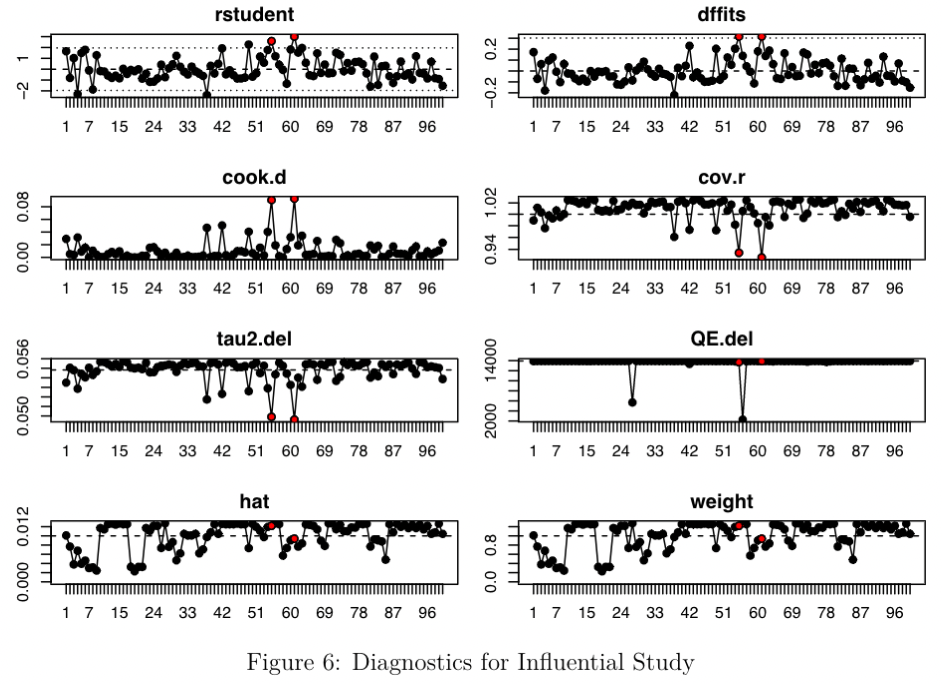
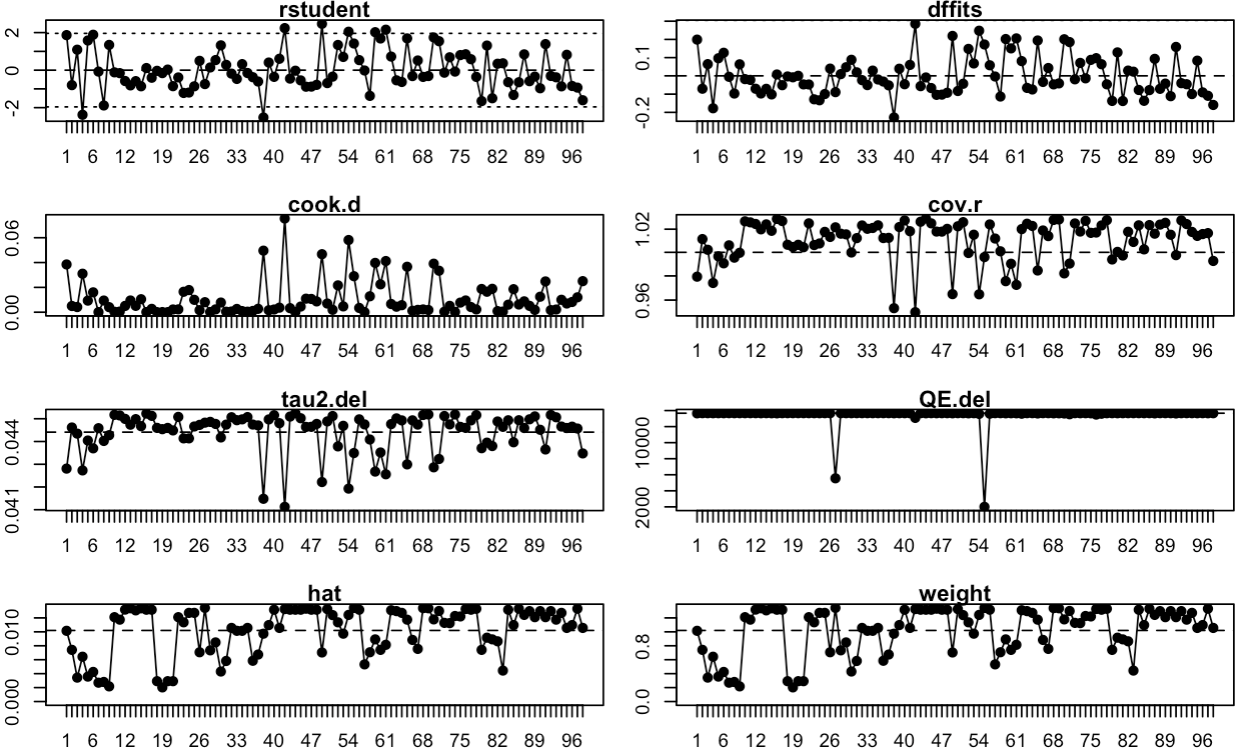
After exploring the descriptive overview of the metadata to seek which measures are applied more than the others, my next analytical strategy was a heterogeneity test to investigate the level of heterogeneity, i.e., whether the estimates across studies tend to diverge or converge. I employed an I-squared and tau-squared restricted maximum likelihood estimator to test for heterogeneity (Borenstein et al., 2010). Next, I estimated the effect size across measures of economic perceptions. As the true estimates of the metadata may differ from one study to another due to scale heterogeneity of the variables of interest, I applied a random-effects model. These models reveal the overall estimate from all studies included in the meta-analysis. Lastly, I employed diagnostic measures to look for influential studies and publication biases (Egger et al., 1997).

Results

Looking at the measures of performance employed in the studies, Table 1 shows that sociotropic evaluations (59) were somewhat more common than pocketbook evaluations (41); studies also more commonly used retrospective (69) rather than prospective (31) judgments. The descriptive analysis showed more than three-quarters of coefficients on sociotropic measures were statistically significant. In contrast, only 40% of pocketbook measures returned statistically significant estimates. Studies that used sociotropic evaluation with retrospective judgments were particularly likely to return statistically significant coefficients (86.49%).

Table 1.Distribution of Measures of Economic Voting
Measures N Sig (%) \(I^{2}\) \[\tau^{2}\]
Pocketbook 41 40.00 95.93 0.0368*
Sociotropic 59 76.36 99.49 0.0624*
Prospective 31 46.67 94.74 0.0398*
Retrospective 69 67.69 99.44 0.0594*
Pocketbook-Prospective 12 33.33 7.82 0.0002 
Pocketbook-Retrospective 29 42.86 96.92 0.0444*
Sociotropic-Prospective 19 55.56 95.73 0.0516*
Sociotropic-Retrospective 40 86.49 99.64 0.0660*

Note. N = the number of estimates across the metadata; Sig (%) = The proportion of the estimates (percentage from each category of the economic measure) that are statistically significant at p < .05 significance level; \(I^{2}\)= total heterogeneity (0-100%); \(\tau^{2}\) = estimated amount of total heterogeneity (0-1); * (asterisk) = the Q-test of the heterogeneity at the p < .05 significance level

As reported in the last two columns of Table 1, the heterogeneity test statistics from all measures are similar, except for Pocketbook-Prospective—I did not find significant heterogeneity across the estimates of this measure. As higher \(I^{2}\) and the \(\tau^{2}\) statistics mean more heterogenous estimates in each measure, the results imply that findings of economic voting studies diverge. The heterogenous findings are not surprising. However, the extent to which the economic voting studies diverge was relatively high across measures. A closer look nevertheless suggests that the coefficients of the sociotropic-retrospective measure (\(I^{2}\) of 99.64% and \(\tau^{2}\)of .066) diverge more but are also the most likely to be significant relative to those of the other measures.

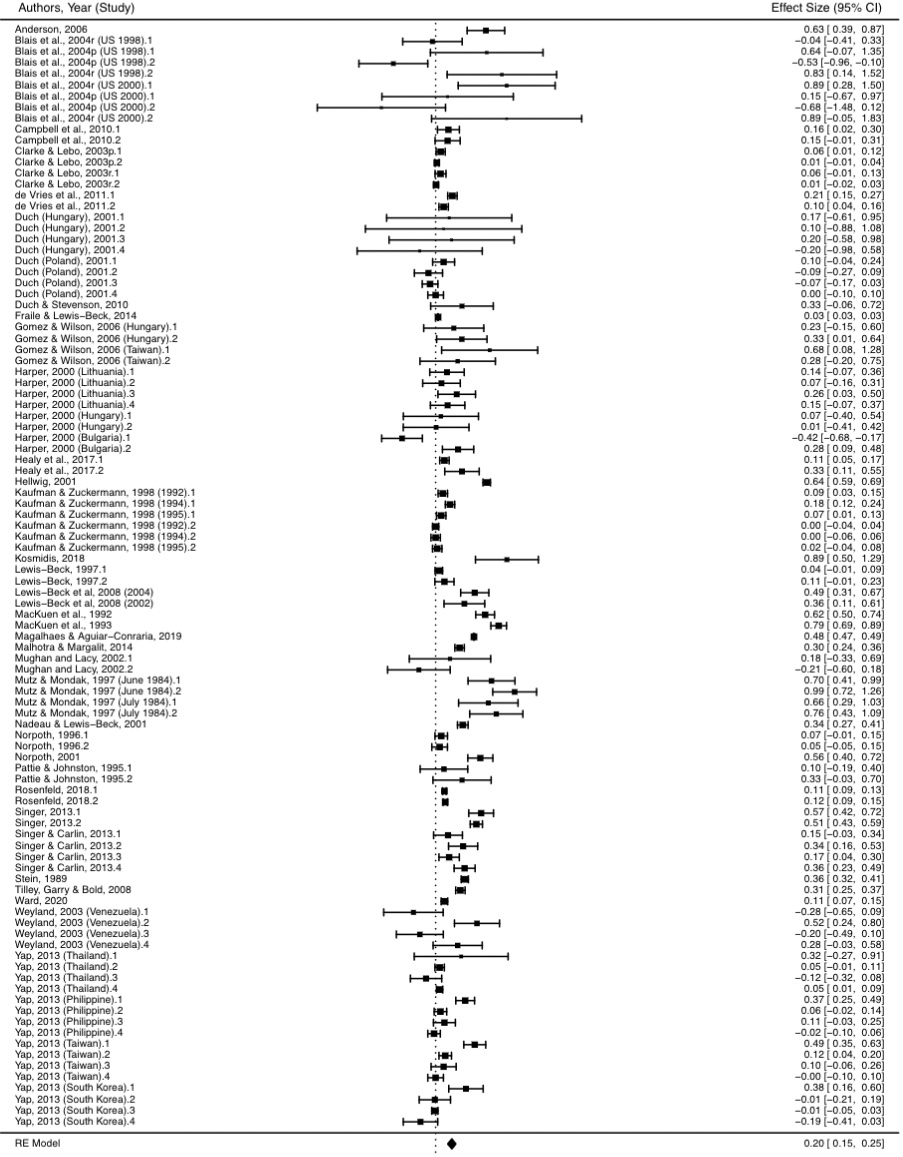
As shown in Figure 1, overall, I found a positive relationship between economic perceptions and support for incumbent reelection across 100 measures. The average effect size was .20 (log odds ratio) which means that, all else equal, a positive economic perception affects the likelihood of voting for the incumbent at 1.2 odds. Details of the metadata and results are in Table B1 and Table C1 in the Appendix.

Diagram, schematic Description automatically generated
Figure 1.Forest Plot: Estimating Effects of the Overall Studies (see Appendix A for details)

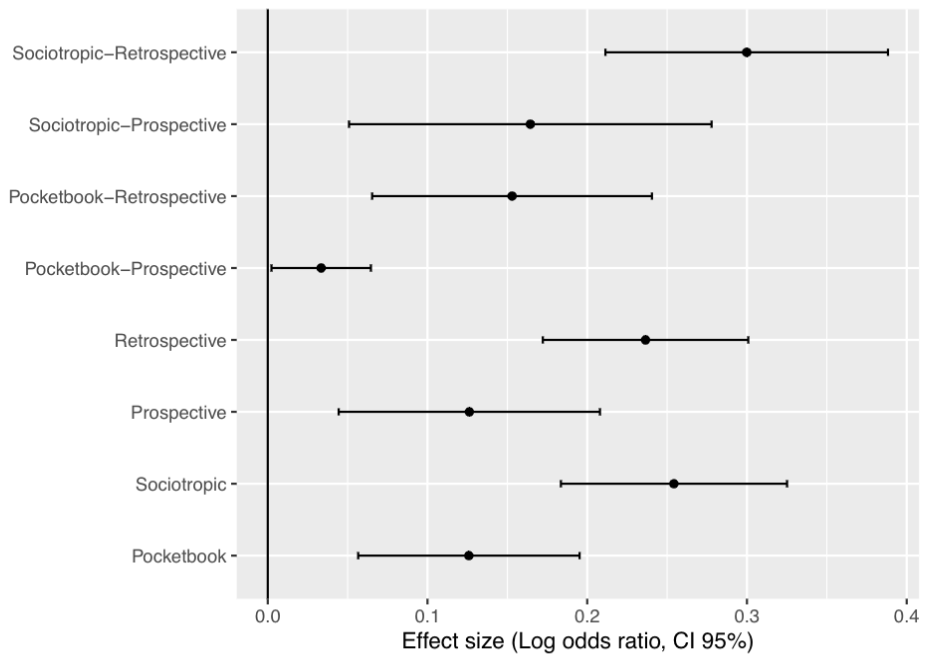
Importantly, the meta-analysis uncovered that the estimated effect size for sociotropic-retrospective measures (log odds ratio of 0.30), displayed in Figure 2 was relatively higher (about twice higher) than that for sociotropic-prospective measures (log odds ratio of .16) and pocketbook-retrospective measures (log odds ratio of .15), though their confidence intervals overlap one another (for statistical details, see Table C1 in Appendix C). The pocketbook-prospective measure, nevertheless, is recorded to have a very low predictive power (log odds ratio of .03) such that future studies may need to avoid or refine the questions used to obtain pocketbook-prospective measures.

Chart, scatter chart Description automatically generated
Figure 2.Variation in Meta-Analysis Effect Size by Economic Voting Measures

Most of the estimated coefficients, shown also in Figure 1, are positive, with many of them statistically significant; when negative coefficients—a result that does not meet theoretical expectations—are estimated, most of them are indistinguishable from zero. While the largest estimates are .99 (Mutz & Mondak, 1997) and .89 (Blais et al., 2004) in the sociotropic and retrospective models respectively, the smallest estimates are -0.53 (sociotropic model) and -0.68 (pocketbook model), which both come from Blais et al.'s studies (2004). In the sociotropic model, I only observed two negative coefficients found in prospective perceptions in the U.S. 1998 data (Blais et al., 2004) and also prospective judgment in the Poland study (Duch, 2001). In the pocketbook model, we have five negative estimates from studies contained in three articles (Blais et al., 2004; Duch, 2001; Mughan & Lacy, 2002), where only one of them stems from a prospective question. These patterns may suggest that prospective judgment about national or general economic conditions is a less convincing measure.

We may suspect that some variation in effect size is due to the temporal or country context. I examined studies that measured both sociotropic and pocketbook perceptions in the same contexts (countries or periods of the study), excluding studies that only report a single measure (e.g., C. D. Anderson, 2006; Lewis-Beck et al., 2008; Ward, 2020). In this subset of studies, as shown in Appendix C, the estimated effect size of the sociotropic measure was still higher than that of the pocketbook measure, although the average effect size for the sociotropic estimate falls by 0.26 log-odds points, whereas the pocketbook estimate falls by only 0.16 points. These estimates reinforce the initial meta-analysis results that sociotropic - retrospective measures have stronger predictive power than the other measures. Publication bias and influential study diagnostics in Appendix C also show that the results are robust.

Discussion

Two logics might explain the findings presented above. First, sociotropic perceptions might conceptually have a more direct link to assessing incumbent performance. The measures might more tangibly capture the collective consciousness when compared to assessments of personal or household economic performance. This claim might be validated through larger batteries of psychological measures that explore voters’ feelings or emotions about economic performance. Moreover, the pocketbook measure complicates whether we should address individual’s or household’s economic conditions—such as “your financial situation” in Fiorina’s (1978) pioneering survey and “family’s financial situation” in Mutz and Mondak’s (1997) South Bend study—while we do not find such an enigmatic case in sociotropic one.

Second, retrospective evaluations of economic conditions or performance are arguably based on factual judgments, and such experiential assessments better predict incumbent survival. Meanwhile, prospective measures are necessarily more perceptual but less factual, which in turn might lead such measures to be less predictive than the retrospective ones. While being a banker-like voter does not necessarily require a high level of knowledge and sophistication to calculate or to predict the future, as contended by MacKuen et al. (1992), experiential evaluation strongly promoted under a retrospective approach obviously necessitates less effort than a predictive attempt.

Furthermore, though the current article meta-analyzes economic voting studies at the micro level, mostly based on survey research, the finding touches a link to studies exploiting macro-economic data. Given the result that sociotropic-retrospective measure is superior relative to the other measures on individual-level studies, such a measure might better mitigate what Dassonneville and Lewis-Beck (2014) called a micrological fallacy. Sociotropic measures force individuals to assess national economic conditions while pocketbook question asks respondents to merely evaluate their household economic condition. Though this article does not imply that it resolves the debate between ecological and macrological fallacies—traced back to Fiorina’s individual-level survey data and Kramer’s macro-economic data since the onset of economic voting studies in the 1970s—the conclusion on the preferred sociotropic measure might slightly reconcile the two camps of economic voting studies, i.e., we should pay more attention to national (or general) economic conditions.

We might need to be cautious, however, with the timeframe used in retrospective measure since existing studies for evaluating economic conditions range between “the last 6 months” and “the last few years.” Though this paper does not meta-analyze the timeframe as these details are mostly not reported in the selected articles, variation in time span potentially creates variation in effect sizes (Achen & Bartels, 2017, Chapters 6–7). For instance, while six-month evaluations seem to be better from the point of view of voters’ capacity, they neglect the majority of the incumbent’s administration. Also, the “last few years” measure might better approximate a comprehensive evaluation, but voters’ capacity might not be suitable for this. This is also a useful area for future research.

Conclusion

Given the results and discussion, I conclude that economic voting studies are better equipped by a measure that approximates a direct nexus between voter’s national economic perception and incumbent survival formulated in sociotropic evaluation, and an experiential perception exemplified by retrospective judgment. Furthermore, the predictive power of a sociotropic measure revealed by the meta-analysis at some points reconciles the theoretical debate between individual-level and macro-economic approaches. Further methodological examinations, nevertheless, need to be attempted in individual-level studies in response to critiques on economic voting theories, e.g., potential myopic judgment and violated economic evaluation by random shocks.


Acknowledgment

I am indebted to Matt Winters for his feedback at various stages of the manuscript. I also want to express my gratitude to my beloved wife, Lutviah, for her contributive assistance. I thank the three anonymous reviewers for their constructive feedback.

Accepted: October 05, 2024 KST

References

Achen, C. H., & Bartels, L. M. (2017). Democracy for realists: Why elections do not produce responsive government (Vol. 4). Princeton University Press.
Google Scholar
Ahmadov, A. K. (2014). Oil, democracy, and context: A meta-analysis. Comparative Political Studies, 47(9), 1238–1267. https:/​/​doi.org/​10.1177/​0010414013495358
Google Scholar
Alt, J. E., Lassen, D. D., & Marshall, J. (2016). Credible sources and sophisticated voters: When does new information induce economic voting? The Journal of Politics, 78(2), 327–342. https:/​/​doi.org/​10.1086/​683832
Google Scholar
Anderson, C. D. (2006). Economic voting and multilevel governance: A comparative individual-level analysis. American Journal of Political Science, 50(2), 449–463. https:/​/​doi.org/​10.1111/​j.1540-5907.2006.00194.x
Google Scholar
Anderson, C. J. (2007). The end of economic voting? Contingency dilemmas and the limits of democratic accountability. Annual Review of Political Science, 10(1), 271–296. https:/​/​doi.org/​10.1146/​annurev.polisci.10.050806.155344
Google Scholar
Barabas, J., Jerit, J., Pollock, W., & Rainey, C. (2014). The question(s) of political knowledge. The American Political Science Review, 108(4), 840–855. https:/​/​doi.org/​10.1017/​S0003055414000392
Google Scholar
Blais, A., Turgeon, M., Gidengil, E., Nevitte, N., & Nadeau, R. (2004). Which matters most? Comparing the impact of issues and the economy in American, British and Canadian elections. British Journal of Political Science, 34(3), 555–563. https:/​/​doi.org/​10.1017/​S0007123404220178
Google Scholar
Borenstein, M., Hedges, L. V., Higgins, J. P. T., & Rothstein, H. R. (2010). A basic introduction to fixed-effect and random-effects models for meta-analysis. Research Synthesis Methods, 1(2), 97–111. https:/​/​doi.org/​10.1002/​jrsm.12
Google Scholar
Bullock, J. G., Gerber, A. S., Hill, S. J., & Huber, G. A. (2013). Partisan bias in factual beliefs about politics (NBER Working Paper No. 19080). National Bureau of Economic Research. https:/​/​doi.org/​10.3386/​w19080
Bullock, J. G., & Lenz, G. (2019). Partisan bias in surveys. Annual Review of Political Science, 22(1), 325–342. https:/​/​doi.org/​10.1146/​annurev-polisci-051117-050904
Google Scholar
Conover, P. J., & Feldman, S. (1986). Emotional reactions to the economy: I’m mad as hell and I’m not going to take it anymore. American Journal of Political Science, 30(1), 50–78. https:/​/​doi.org/​10.2307/​2111294
Google Scholar
Converse, P. E. (2006). The nature of belief systems in mass publics. Critical Review, 18(1–3), 1–74. https:/​/​doi.org/​10.1080/​08913810608443650 (Original work published 1964)
Google Scholar
Dassonneville, R., & Lewis-Beck, M. S. (2014). Macroeconomics, economic crisis and electoral outcomes: A national European pool. Acta Politica, 49(4), 372–394. https:/​/​doi.org/​10.1057/​ap.2014.12
Google Scholar
Duch, R. M. (2001). A developmental model of heterogeneous economic voting in new democracies. American Political Science Review, 95(4), 895–910. https:/​/​doi.org/​10.1017/​S0003055400400080
Google Scholar
Egger, M., Davey Smith, G., Schneider, M., & Minder, C. (1997). Bias in meta-analysis detected by a simple, graphical test. BMJ: British Medical Journal, 315(7109), 629–634. https:/​/​doi.org/​10.1136/​bmj.315.7109.629
Google Scholar
Fiorina, M. P. (1978). Economic retrospective voting in American national elections: A micro-analysis. American Journal of Political Science, 22(2), 426–443. https:/​/​doi.org/​10.2307/​2110623
Google Scholar
Fiorina, M. P. (1981). Retrospective voting in American national elections. Yale University Press.
Google Scholar
Fleiss, J. L., & Berlin, J. (2019). Effect sizes for dichotomous data. In H. Cooper, L. V. Hedges, & J. C. Valentine (Eds.), The Handbook of Research Synthesis and Meta-Analysis (3rd ed., pp. 237–253). Russell Sage Foundation.
Google Scholar
Healy, A. J., Persson, M., & Snowberg, E. (2017). Digging into the pocketbook: Evidence on economic voting from income registry data matched to a voter survey. American Political Science Review, 111(4), 771–785. https:/​/​doi.org/​10.1017/​S0003055417000314
Google Scholar
Hellwig, T. (2012). Constructing accountability: Party position taking and economic voting. Comparative Political Studies, 45(1), 91–118. https:/​/​doi.org/​10.1177/​0010414011422516
Google Scholar
Hunter, J. E., Schmidt, F. L., & Jackson, G. B. (1982). Meta-Analysis: Cumulating Research Findings Across Studies. SAGE Publications.
Google Scholar
Kinder, D. R., & Kiewet, D. R. (1979). Economic discontent and political behavior: The role of personal grievances and collective economic judgments in congressional voting. American Journal of Political Science, 23(3), 495–527. https:/​/​doi.org/​10.2307/​2111027
Google Scholar
Kinder, D. R., & Kiewiet, D. R. (1981). Sociotropic politics: The American case. British Journal of Political Science, 11(2), 129–161. https:/​/​doi.org/​10.1017/​S0007123400002544
Google Scholar
Klašnja, M., Tucker, J. A., & Deegan-Krause, K. (2016). Pocketbook vs. sociotropic corruption voting. British Journal of Political Science, 46(1), 67–94. https:/​/​doi.org/​10.1017/​S0007123414000088
Google Scholar
Kramer, G. H. (1971). Short-term fluctuations in US voting behavior, 1896-1964. The American Political Science Review, 65(1), 131–143. https:/​/​doi.org/​10.2307/​1955049
Google Scholar
Kramer, G. H. (1983). The ecological fallacy revisited: Aggregate-versus individual-level findings on economics and elections, and sociotropic voting. The American Political Science Review, 92–111. https:/​/​doi.org/​10.2307/​1956013
Google Scholar
Kuklinski, J. H., & West, D. M. (1981). Economic expectations and voting behavior in united states house and senate elections. The American Political Science Review, 75(2), 436–447. https:/​/​doi.org/​10.2307/​1961376
Google Scholar
Lane, R. (1962). Political ideology: Why the American common man believes what he does. Free Press of Glencoe.
Google Scholar
Lewis-Beck, M. S. (1997). Who’s the chef? Economic voting under a dual executive. European Journal of Political Research, 31(3), 315–325. https:/​/​doi.org/​10.1111/​j.1475-6765.1997.tb01168.x
Google Scholar
Lewis-Beck, M. S., Nadeau, R., & Elias, A. (2008). Economics, party, and the vote: Causality issues and panel data. American Journal of Political Science, 52(1), 84–95. https:/​/​doi.org/​10.1111/​j.1540-5907.2007.00300.x
Google Scholar
Lewis-Beck, M. S., & Ratto, M. C. (2013). Economic voting in Latin America: A general model. Electoral Studies, 32(3), 489–493. https:/​/​doi.org/​10.1016/​j.electstud.2013.05.023
Google Scholar
Lewis-Beck, M. S., & Stegmaier, M. (2000). Economic determinants of electoral outcomes. Annual Review of Political Science, 3(1), 183–219. https:/​/​doi.org/​10.1146/​annurev.polisci.3.1.183
Google Scholar
MacKuen, M. B., Erikson, R. S., & Stimson, J. A. (1992). Peasants or bankers? The American electorate and the U.S. economy. American Political Science Review, 86(3), 597–611. https:/​/​doi.org/​10.2307/​1964124
Google Scholar
Meehl, P. E. (1977). The selfish voter paradox and the thrown-away vote argument. The American Political Science Review, 71(1), 11–30. https:/​/​doi.org/​10.2307/​1956951
Google Scholar
Mughan, A., & Lacy, D. (2002). Economic performance, job insecurity and electoral choice. British Journal of Political Science, 32(3), 513–533. https:/​/​doi.org/​10.1017/​S0007123402000212
Google Scholar
Mutz, D. C., & Mondak, J. J. (1997). Dimensions of sociotropic behavior: Group-based judgements of fairness and well-being. American Journal of Political Science, 41(1), 284–308. https:/​/​doi.org/​10.2307/​2111717
Google Scholar
Nannestad, P., & Paldam, M. (1995). It’s the government’s fault! A cross-section study of economic voting in Denmark, 1990/93. European Journal of Political Research, 28(1), 33–62. https:/​/​doi.org/​10.1111/​j.1475-6765.1995.tb00486.x
Google Scholar
Nannestad, P., & Paldam, M. (1997). From the Pocketbook of the Welfare Man: A Pooled Cross-Section Study of Economic Voting in Denmark, 1986–92. British Journal of Political Science, 27(1), 111–155. https:/​/​doi.org/​10.1017/​S0007123497220053
Google Scholar
Singer, M. M. (2011). Who says “It’s the economy”? Cross-national and cross-individual variation in the salience of economic performance. Comparative Political Studies, 44(3), 284–312. https:/​/​doi.org/​10.1177/​0010414010384371
Google Scholar
Singer, M. M. (2013). What goes around comes around: Perceived vulnerable employment and economic voting in developing countries. European Journal of Political Research, 52(2), 143–163. https:/​/​doi.org/​10.1111/​j.1475-6765.2012.02066.x
Google Scholar
Singer, M. M., & Carlin, R. E. (2013). Context counts: The Election cycle, development, and the nature of economic voting. The Journal of Politics, 75(3), 730–742. https:/​/​doi.org/​10.1017/​S0022381613000467
Google Scholar
Tufte, E. R. (1975). Determinants of the Outcomes of Midterm Congressional Elections. The American Political Science Review, 69(3), 812–826. https:/​/​doi.org/​10.2307/​1958391
Google Scholar
Ward, G. (2020). Happiness and voting: Evidence from four decades of elections in Europe. American Journal of Political Science, 64(3), 504–518. https:/​/​doi.org/​10.1111/​ajps.12492
Google Scholar

Appendices

APPENDIX A: Inclusion Procedures of the Journals and Articles

Table A1.Top-Ten Journals Based on Scimagojr and Google Scholar
Scimagojr1 Google Scholar2
Journals h-index Journals h5-index
American Political Science Review 182 American Journal of Political Science 69
American Journal of Political Science 180 American Political Science Review 68
International Organization 151 Journal of European Public Policy 66
World Politics 114 The Journal of Politics 60
International Security 113 British Journal of Political Science 54
Journal of Conflict Resolution 113 Comparative Political Studies 53
Journal of Peace Research 108 Annual Review of Political Science 51
International Studies Quarterly 106 JCMS: Journal of Common Market Studies 51
Political Psychology 102 European Journal of Political Research 47
British Journal of Political Science 101 Journal of Democracy 46

Note. 1) The Scimagojr.com ranking is based on citations for all years of the journal publication (Accessed March 2022). Sorting procedures were as follows: Social Sciences | Political Science and International Relations | All regions / countries | All types | 2021.
2) Google.Scholar ranking is based on recorded citations between 2017-2022 (Accessed July 2022). Sorting procedures is as follows: Categories | Social Sciences | Political Science | 2017-2022.

Table A2.Economic Voting Studies in the Top-Ten Selected Journals
Selected Journals Relevant Articlesa Selected Articlesb Meta-Data Articlesc Reported Measuresd
American Journal of Political Science 30 11 9 25
American Political Science Review 29 4 4 16
The Journal of Politics 25 10 9 14
British Journal of Political Science 24 5 2 8
Comparative Political Studies 20 4 4 28
European Journal of Political Research 20 5 3 8
Annual Review of Political Science 4 1 0 0
Political Psychology 3 1 1 1
World Politics 0 0 0 0
Journal of Democracy 0 0 0 0
Total 155 41 32 100

Note. a) Relevant Articles: Articles that discuss or examine economic voting.
b) Selected Articles: Individual-level studies that employ either pocketbook or sociotropic measures.
c) Meta-Data Articles: Articles that report coefficients for the given measures along with standard errors.
d) Reported Measures: The number of reported coefficients.

APPENDIX B: Metadata

Table B1.Details of the Metadata
Author Year (Study) Evaluation Judgment Coefficient se Sample Country Journal yi vi
Anderson 2006 socio retro 0.63 0.12 25238 US AJPS 0.630 0.014
Blais et al. 2004r (US 1998) pocket retro -0.04 0.19 649 US AJPS -0.040 0.036
Blais et al. 2004p (US 1998) pocket prosp 0.64 0.36 649 US AJPS 0.640 0.130
Blais et al. 2004p (US 1998) socio prosp -0.53 0.22 649 US AJPS -0.530 0.048
Blais et al. 2004r (US 1998) socio retro 0.83 0.35 649 US AJPS 0.830 0.123
Blais et al. 2004r (US 2000) socio retro 0.89 0.31 507 US AJPS 0.890 0.096
Blais et al. 2004p (US 2000) socio prosp 0.15 0.42 507 US AJPS 0.150 0.176
Blais et al. 2004p (US 2000) pocket retro -0.68 0.41 507 US AJPS -0.680 0.168
Blais et al. 2004r (US 2000) pocket prosp 0.89 0.48 507 US AJPS 0.890 0.230
Campbell et al. 2010 socio retro 0.16 0.07 15257 US JOP 0.160 0.005
Campbell et al. 2010 socio prosp 0.15 0.08 15257 US JOP 0.150 0.006
Clarke & Lebo 2003p pocket prosp 0.06 0.03 210 UK BJPS 0.063 0.001
Clarke & Lebo 2003p socio prosp 0.02 0.01 210 UK BJPS 0.015 0.000
Clarke & Lebo 2003r pocket retro 0.06 0.04 210 UK BJPS 0.061 0.001
Clarke & Lebo 2003r socio retro 0.01 0.02 210 UK BJPS 0.005 0.000
de Vries et al. 2011 socio prosp 0.21 0.03 11688 Europe CPS 0.210 0.001
de Vries et al. 2011 socio retro 0.10 0.03 11688 Europe CPS 0.100 0.001
Duch (Hungary) 2001 socio retro 0.17 0.40 1498 Hungary APSR 0.170 0.160
Duch (Hungary) 2001 socio prosp 0.10 0.50 1498 Hungary APSR 0.100 0.250
Duch (Hungary) 2001 pocket retro 0.20 0.40 1498 Hungary APSR 0.200 0.160
Duch (Hungary) 2001 pocket prosp -0.20 0.40 1498 Hungary APSR -0.200 0.160
Duch (Poland) 2001 socio retro 0.10 0.07 1199 Poland APSR 0.100 0.005
Duch (Poland) 2001 socio prosp -0.09 0.09 1199 Poland APSR -0.090 0.008
Duch (Poland) 2001 pocket retro -0.07 0.05 1199 Poland APSR -0.070 0.003
Duch (Poland) 2001 pocket prosp 0.00 0.05 1199 Poland APSR 0.000 0.003
Duch & Stevenson 2010 socio retro 0.33 0.20 Multi JOP 0.330 0.040
Fraile & Lewis-Beck 2014 socio retro 0.03 0.00 18838 Europe EJPR 0.030 0.000
Gomez & Wilson 2006 (Hungary) pocket retro 0.23 0.19 679 Hungary AJPS 0.227 0.037
Gomez & Wilson 2006 (Hungary) socio retro 0.33 0.16 679 Hungary AJPS 0.328 0.026
Gomez & Wilson 2006 (Taiwan) socio retro 0.68 0.31 836 Taiwan AJPS 0.677 0.094
Gomez & Wilson 2006 (Taiwan) pocket retro 0.28 0.24 836 Taiwan AJPS 0.276 0.058
Harper 2000 (Lithuania) pocket retro 0.14 0.11 730 Lithuania CPS 0.142 0.012
Harper 2000 (Lithuania) pocket prosp 0.07 0.12 730 Lithuania CPS 0.073 0.014
Harper 2000 (Lithuania) socio retro 0.26 0.12 730 Lithuania CPS 0.264 0.014
Harper 2000 (Lithuania) socio prosp 0.15 0.11 730 Lithuania CPS 0.150 0.012
Harper 2000 (Hungary) pocket retro 0.07 0.24 582 Hungary CPS 0.066 0.058
Harper 2000 (Hungary) pocket prosp 0.01 0.21 582 Hungary CPS 0.006 0.044
Harper 2000 (Bulgaria) socio retro -0.42 0.13 719 Bulgaria CPS -0.421 0.017
Harper 2000 (Bulgaria) socio prosp 0.28 0.10 719 Bulgaria CPS 0.281 0.010
Healy et al. 2017 socio retro 0.11 0.03 854 Sweden APSR 0.110 0.001
Healy et al. 2017 pocket retro 0.33 0.11 854 Sweden APSR 0.330 0.012
Hellwig 2001 socio retro 0.64 0.02 14490 OECD JOP 0.640 0.001
Kaufman & Zuckermann 1998 (1992) socio retro 0.09 0.03 1616 US APSR 0.090 0.001
Kaufman & Zuckermann 1998 (1994) socio retro 0.18 0.03 1588 US APSR 0.180 0.001
Kaufman & Zuckermann 1998 (1995) socio retro 0.07 0.03 896 US APSR 0.070 0.001
Kaufman & Zuckermann 1998 (1992) pocket retro 0.00 0.02 1616 US APSR 0.000 0.000
Kaufman & Zuckermann 1998 (1994) pocket retro 0.00 0.03 1588 US APSR 0.000 0.001
Kaufman & Zuckermann 1998 (1995) pocket retro 0.02 0.03 896 US APSR 0.020 0.001
Kosmidis 2018 socio retro 0.89 0.20 1019 US AJPS 0.893 0.040
Lewis-Beck 1997 socio retro 0.04 0.02 302 Paris EJPR 0.040 0.001
Lewis-Beck 1997 socio prosp 0.11 0.06 302 Paris EJPR 0.110 0.004
Lewis-Beck et al 2008 (2004) socio retro 0.49 0.09 629 US AJPS 0.490 0.008
Lewis-Beck et al 2008 (2002) socio retro 0.36 0.13 593 US AJPS 0.360 0.017
MacKuen et al. 1992 pocket retro 0.62 0.06 126 US APSR 0.620 0.004
MacKuen et al. 1993 socio prosp 0.79 0.05 110 US APSR 0.790 0.003
Magalhaes & Aguiar-Conraria 2019 socio retro 0.48 0.00 42656 Multi PolPsy 0.480 0.000
Malhotra & Margalit 2014 socio retro 0.30 0.03 US JOP 0.300 0.001
Mughan and Lacy 2002 socio retro 0.18 0.26 726 US BJPS 0.180 0.068
Mughan and Lacy 2002 pocket retro -0.21 0.20 726 US BJPS -0.210 0.040
Mutz & Mondak 1997 (June 1984) pocket retro 0.70 0.15 1101 US AJPS 0.700 0.023
Mutz & Mondak 1997 (June 1984) socio retro 0.99 0.14 1101 US AJPS 0.990 0.020
Mutz & Mondak 1997 (July 1984) pocket retro 0.66 0.19 848 US AJPS 0.660 0.036
Mutz & Mondak 1997 (July 1984) socio retro 0.76 0.17 848 US AJPS 0.760 0.029
Nadeau & Lewis-Beck 2001 pocket retro 0.34 0.03 11969 US JOP 0.340 0.001
Norpoth 1996 socio retro 0.07 0.04 US JOP 0.070 0.002
Norpoth 1996 socio prosp 0.05 0.05 US JOP 0.050 0.003
Norpoth 2001 socio retro 0.56 0.08 US JOP 0.560 0.006
Pattie & Johnston 1995 pocket retro 0.10 0.15 2699 UK EJPR 0.104 0.023
Pattie & Johnston 1995 socio retro 0.33 0.19 2699 UK EJPR 0.331 0.035
Rosenfeld 2018 pocket retro 0.11 0.01 25887 US AJPS 0.110 0.000
Rosenfeld 2018 socio retro 0.12 0.01 25887 US AJPS 0.120 0.000
Singer 2013 socio retro 0.57 0.08 6817 Latin America EJPR 0.570 0.006
Singer 2013 pocket retro 0.51 0.04 6817 Latin America EJPR 0.510 0.002
Singer & Carlin 2013 socio retro 0.16 0.09 152630 Multi JOP 0.155 0.008
Singer & Carlin 2013 socio prosp 0.34 0.09 152631 Multi JOP 0.344 0.009
Singer & Carlin 2013 pocket retro 0.17 0.07 152632 Multi JOP 0.169 0.004
Singer & Carlin 2013 socio prosp 0.36 0.07 152633 Multi JOP 0.363 0.004
Stein 1989 pocket retro 0.37 0.02 22210 U.S. States JOP 0.365 0.001
Tilley, Garry & Bold 2008 socio retro 0.31 0.03 13608 Europe EJPR 0.310 0.001
Ward 2020 pocket retro 0.11 0.02 67040 Europe AJPS 0.110 0.000
Weyland 2003 (Venezuela) socio retro -0.28 0.19 847 Venezuela CPS -0.278 0.036
Weyland 2003 (Venezuela) socio prosp 0.52 0.14 847 Venezuela CPS 0.518 0.021
Weyland 2003 (Venezuela) pocket retro -0.20 0.15 847 Venezuela CPS -0.198 0.023
Weyland 2003 (Venezuela) pocket prosp 0.28 0.16 847 Venezuela CPS 0.276 0.025
Yap 2013 (Thailand) socio retro 0.32 0.30 965 Thailand CPS 0.320 0.090
Yap 2013 (Thailand) socio prosp 0.05 0.03 965 Thailand CPS 0.050 0.001
Yap 2013 (Thailand) pocket retro -0.12 0.10 965 Thailand CPS -0.120 0.010
Yap 2013 (Thailand) pocket prosp 0.05 0.02 965 Thailand CPS 0.050 0.000
Yap 2013 (Philippines) socio retro 0.37 0.06 826 Philippines CPS 0.370 0.004
Yap 2013 (Philippines) socio prosp 0.06 0.04 827 Philippines CPS 0.060 0.002
Yap 2013 (Philippines) pocket retro 0.11 0.07 828 Philippines CPS 0.110 0.005
Yap 2013 (Philippines) pocket prosp -0.02 0.04 829 Philippines CPS -0.020 0.002
Yap 2013 (Taiwan) socio retro 0.49 0.07 933 Taiwan CPS 0.490 0.005
Yap 2013 (Taiwan) socio prosp 0.12 0.04 934 Taiwan CPS 0.120 0.002
Yap 2013 (Taiwan) pocket retro 0.10 0.08 935 Taiwan CPS 0.100 0.006
Yap 2013 (Taiwan) pocket prosp -0.00 0.05 936 Taiwan CPS 0.000 0.003
Yap 2013 socio retro 0.38 0.11 634 South Korea CPS 0.380 0.012
Yap 2013 socio prosp -0.01 0.10 635 South Korea CPS -0.010 0.010
Yap 2013 pocket retro -0.01 0.02 636 South Korea CPS -0.010 0.000
Yap 2013 pocket prosp -0.19 0.11 637 South Korea CPS -0.190 0.012

APPENDIX C: Estimates and Contextual Effect Size

Table C1.Meta-Analysis of the Categories of Measurement Strategies in Individual-Level Studies of Economic Voting
Measures Estimate se z p ci.lb ci.ub
All Measures 0.20 0.03 7.66 .000 0.15 0.25
Pocketbook 0.13 0.04 3.56 .000 0.06 0.20
Sociotropic 0.25 0.04 7.04 .000 0.18 0.33
Prospective 0.13 0.04 3.02 .002 0.04 0.21
Retrospective 0.24 0.03 7.21 .000 0.17 0.30
Sociotropic-Prospective 0.16 0.06 2.84 .005 0.05 0.28
Sociotropic-Retrospective 0.30 0.05 6.64 .000 0.21 0.39
Pocketbook-Prospective 0.03 0.02 2.11 .035 0.00 0.06
Pocketbook-Retrospective 0.15 0.04 3.42 .001 0.07 0.24
Diagram Description automatically generated with low confidence
Figure C1.Comparable Forest Plots Between Sociotropic (Left-Hand Side) and Pocketbook (Right-Hand Side) Based on Country and Time of the Studies

APPENDIX D: Robustness

Publication Bias

The funnel plot in Figure D1 displays whether or not the publication bias is present where the dots are the estimates in each study. While the x-axis refers to the effect size or estimates (log odds ratio) of the economic evaluation, the standard error in the y-axis represents the precision of the estimates. Studies with sizeable statistical power (small standard errors) are on the top and those with small power are at the bottom. The steep dashed lines are the pseudo 95% confidence interval (for further details, see Egger et al., 1997). The plot displays heterogeneity across studies as some estimates are spread outside the “triangle” or the pseudo confidence interval. However, heterogeneity does not mean bias.

Chart, radar chart Description automatically generated
Figure D1.Funnel Plot of Publication Bias Diagnostics

Publication bias would mean that the studies included in the metanalysis do not capture results from other studies that are not published or published in non-English journals. In this regard, as shown in Figure D1, the symmetric funnel plot shows that the estimates (the dots) are evenly distributed in the left-side and right-side of the overall estimate represented by the dashed vertical line. Publication bias occurs when the funnel plot depicts an asymmetric pattern where most of the estimates are on the right side or the left side of the vertical line (the overall effect size), which is not in the case of Figure D1. A regression test for the funnel plot asymmetry reveals a test statistic (p = .172) that is not statistically significant. In other words, the resulting estimates of both the sociotropic and pocketbook meta-analysis models that we have discussed earlier are not influenced by publication bias.

Influential Studies

Furthermore, the influence diagnostic, i.e., a leave-one-out diagnostic for each case (each observation in the metadata), reveals that two studies can be considered influential. An influential study means that there is a study that will drive the results of the meta-analysis model. Note that each plot represents a measure of influence diagnostics. For example, the ‘diffits’ indicate how many standard deviations the predicted (average) effect changes after excluding that case from the model fitting.

As shown in the diagnostic plots in Figure D2, two red-dot (influential) estimates are observed. A red dot within the plots indicates an influential study (estimate). After pulling out these two estimates, i.e., one sociotropic-prospective estimate from MacKuen et al. (1993) and one sociotropic-retrospective estimate from Mutz & Mondak (1997), the sociotropic-retrospective measure (0.28) remains the strongest estimate followed by slight difference between pocketbook-retrospective (0.13) and sociotropic-prospective (0.15), as shown in Figure D3 below. The diagnostics in Figure D4 also show that we no longer have any red dots (influential estimates).

Diagram Description automatically generated with medium confidence
Figure D2.Diagnostics for Influential Studies
Chart, scatter chart Description automatically generated
Figure D3.Meta-Analysis Without Influential Estimates
Diagram Description automatically generated
Figure D4.Influential-Study Diagnostics Without Influential Estimates

  1. The debate on micro- versus macro-level studies has existed since the onset of the literature on economic voting (see Kramer, 1983).

  2. They maintain that "prospective expectations diminishes over the election cycle as the honeymoon ends and [voters] retrospectively evaluate the incumbent’s mounting record (Singer & Carlin, 2013, p. 731).

  3. These scholars analogically view voters who strongly employ prospective judgment for their voting decision as bankers who are used to have their financial decisions based on their predictions over the economic dynamics in the future.

  4. Some employ a term “egotropic” to denote Fiorina’s initial term of pocketbook (see, for example, Lewis-Beck & Stegmaier, 2000; Nannestad & Paldam, 1995, 1997; Singer & Carlin, 2013). This article maintains the original term as it was initially defined and is terminologically straightforward.

  5. Kinder and Kiewiet (1979, p.522) claimed that their study conforms Lane’s (1955) classic study on 15 ordinary Americans that individual’s experiences and judgments which are itemized and fragmented.

  6. Meehl introduces the term of sociotropic in his lengthy dialogue-based model between imaginary Standard Old Party (SOP) and Flat Earth Vegetarian (FEV) when FEV says, “I should not say altruistic, but something weaker, say sociotropic(Meehl, 1977, p. 14).