

Background
The Need for a Representative Survey in South Korea
Public opinion surveys are an important tool, especially in a democracy. They can be used to help form public policy and by public campaigns to understand current attitudes and help plan for future campaigns. Scholars, especially in the social sciences, often use public opinion surveys in their research. To be useful, a survey should be as accurate as possible. Although probability sampling is considered the most scientific and accurate sampling method, it is also cost prohibitive for many scholars.
Some have been tempted to use online panels, but most Internet panels in Korea are problematic, because not everyone uses the Internet. The Internet penetration rate is high in South Korea, with 88.3% of those aged 3 or older having used the Internet within the past month, according to a survey conducted in July 2016 (Ministry of Science, ICT, and Future Planning (MSIFT), 2017). Therefore, if a survey is only conducted online, a portion of the population (just over 11.7% in the case of South Korea) will not be included, making non-coverage error a serious concern. In addition, many online survey panels are voluntary panels, which is not the gold standard in sampling.
It became clear that scholars needed access to a panel that is inexpensive or free to use, but representative of the South Korean public. Based on this need, the National Research Foundation (NRF) supported the Korean Academic Multimode Open Survey (KAMOS), with funding from the Ministry of Education. This paper seeks to evaluate the results from the first year of the KAMOS survey to determine whether it can be considered representative.
Literature Review: Attempts from Other Countries
Other countries have also felt the need for a nationally representative, probability-based, online survey panel.
The first four such panels in Europe that attempted to include non-Internet using households were: the LISS (Longitudinal Internet Studies for the Social sciences) Panel in the Netherlands, the GIP and GESIS Panels in Germany, and the ELIPSS Panel in France (Norway and Iceland also made probability-based Internet panels, but did not attempt to include the non-Internet using population) (Blom et al., 2016). All four of these panels used probability-sampling offline to recruit panel members. To include non-Internet using households, two of the panels, LISS and GESIS, provided Internet and equipment to those households. The ELIPSS Panel provided a tablet and 3G Internet access to all their panel members. The GIP Panel chose to use a multimode approach instead: paper questionnaires are mailed to their panel members without Internet access or those who prefer not to answer online (Blom et al., 2016).
In the USA, probability-based Internet panels include Knowledge Networks (GFK Knowledge Panel®), the American Life Panel (RAND), the Understanding America Study, the Gallup Panel, and AmeriSpeak (NORC). Like their counterparts in Europe, panel members for these panels were recruited offline, using addresses, phone numbers, or a combination of the two (AmeriSpeak, 2015; Gallup, 2017; Hays et al., 2015).
The recruitment rates for these panels are not always as high as ideal. The highest was the LISS Panel, with 48.3%, i.e., of their sample, 48.3% agreed to join the panel (Blom et al., 2016). In comparison, the KnowledgePanel® has an approximate signup rate of about 10% (Hays et al., 2015). It has been suggested that, while non-coverage error and error due to self-selection that come with non-probability based Internet panels is a concern, probability-sampling based panels may also have problems if too many people refuse to participate or drop out (Hays et al., 2015).
Creation of KAMOS
KAMOS, like the other panels mentioned, uses two-stage stratified cluster sample design. The primary sampling unit (PSU) is the geographical units created by Statistics Korea (KOSTAT) and the secondary sampling unit (SSU) is the household. The PSUs are selected with probability proportional to the size of the sampling unit. Out of 82,666 statistical blocks made by KOSTAT, 106 statistical blocks were selected. The SSUs are sampled with equal probability. We attempted to interview all members of selected households aged 18 or older and invited them to join the KAMOS panel. KOSTAT also interviews all members of selected households for many of their surveys, including the KOSTAT Social Survey.
Respondents who do not have Internet access may participate in KAMOS via face-to-face interviews or telephone interviews, making KAMOS a multimode survey. In the second survey, which was mostly conducted online, 9.6% of respondents used another mode.
The initial face-to-face KAMOS survey took place February-May 2016. The sample size was 4,770 people. The response rate was 63% (3,004 people) and participants were asked to participate in the panel. For subsequent surveys, a random sample of 2,000 of the panel members is invited to respond. The second survey took place June 23-August 9, 2016, and the response rate was 50.4% (1,008 people).
Methodology
The results of the KAMOS survey are weighted based on age, sex, and geographical region of Korea and the weighted results were then tested for representativeness.
We analyzed the representativeness of the panel in two ways. First, we wanted to confirm that the demographics of the KAMOS respondents seemed similar to other reputable surveys in Korea. Therefore, we compared the demographics of our respondents to two major surveys in South Korea. The first survey is the KOSTAT Social Survey, which is conducted annually by KOSTAT, the government organization that is responsible for official statistics. The demographic variables from the KOSTAT Social Survey can be considered representative of the country. It should be noted that there are some expected differences, because the KOSTAT Social Survey interviews households instead of individuals. We used the results from the 2015 KOSTAT Social Survey. We also compared our results to the Gallup Korea Omnibus Survey, which is conducted every two months by a private company in South Korea. We looked at the average of the Gallup Korea Omnibus Survey results from 2015. Not all of our demographic variables were collected by both surveys.
To ensure that the results from our panel continued to be valid, we compared the second survey (primarily online, with 9.6% offline) to our initial respondents. Rather than continuing to look only at demographic variables, we checked whether there were actual differences between the answers of those who responded to the first survey and those who responded to the second survey. We took the responses from the first survey of the 2,000 respondents (randomly selected from the 3,004 respondents to the first survey) who were invited to participate in the second survey and compared these responses to the first survey responses of the 1,008 of these 2,000 who responded to the second survey. If there were no statistically significant differences between these two sets of responses, then it would suggest that the KAMOS panel is representative.
Results
Demographic Variables from the Initial Survey
Most of the differences found in the demographic variables between KAMOS and the KOSTAT Social Survey and Gallup Korea Omnibus Survey were relatively small and suggest that, based on demographic variables; KAMOS is representative of the Korean public.
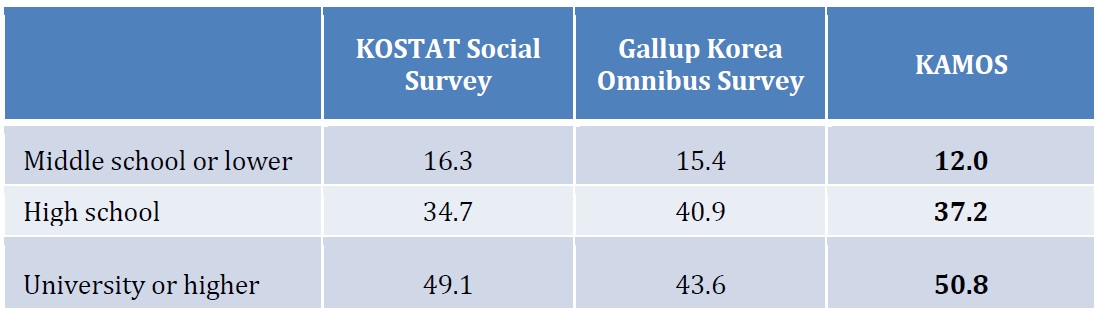
As shown in Table 1, KAMOS respondents may have been slightly more educated than the respondents to other surveys, with fewer having left school before high school and slightly more having attended a university, but again, these were small differences, fewer than 5 percentage points.
.jpg)
The next variable we considered was the type of jobs respondents have. As detailed in Table 2, students seem a little overrepresented in KAMOS (10.6%) compared to the KOSTAT Social Survey (4.2%), while those who were unemployed/other seem a little underrepresented compared to KOSTAT Social Survey (17.5%); however, the percent of unemployed/other respondents to KAMOS is exactly the same as we see in the Gallup Korea Omnibus Survey (4.6%). Blue-collar workers seem to be more overrepresented in the Gallup Korea Omnibus Survey (27.3%) compared to the KOSTAT Social Survey (15.4%). KAMOS is closer to the KOSTAT Social Survey results in this case, with 19.7%.
.jpg)
The marital status of KAMOS respondents was very close to that of the Gallup Korea Omnibus Survey respondents (see Table 3). However, both of these surveys seem to underrepresent the widowed/divorced population (KOSTAT: 11.7%; Gallup 3.9%; KAMOS 5.8%), and therefore over-represent the married population (KOSTAT 65.7%; Gallup 73.1%; KAMOS 72.1%). However, even in this case, the difference is only around six percentage points.
.jpg)
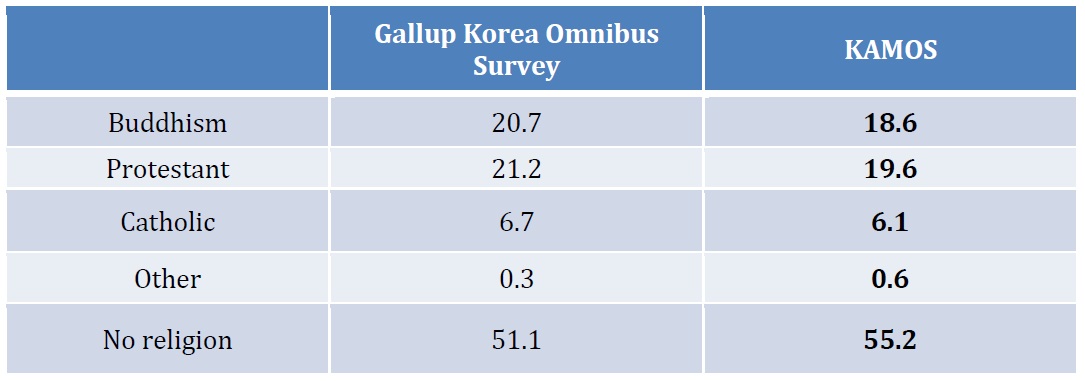
Religion was not considered in the KOSTAT Social Survey. As indicated in Table 4, the KAMOS respondents were close to the Gallup Korea Omnibus Survey. The biggest difference was in those with no religion (Gallup 51.1%; KAMOS 55.2%).
.jpg)
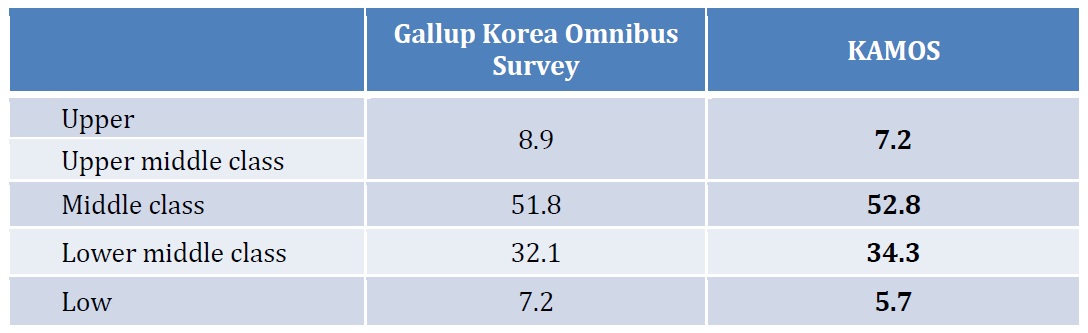
Respondents to KAMOS were asked to rate their standard of living or social class compared to other Koreans on a five-point scale. A similar question on the Gallup Korea Omnibus Survey used a four-point scale. In our analysis (see Table 5), we grouped the top two categories used on KAMOS together to compare the two surveys. This question did not appear on the KOSTAT Social Survey.
It should be noted that this question measures people’s perception of their standard of living; it is not necessarily an accurate assessment of their actual social class or income. Household income was the topic of another question. The majority (52.8%) of KAMOS respondents put themselves in the middle class. Very few people were willing to put themselves in the top two categories (7.2%) or in the lowest category (5.7%). These results were comparable to the results of a similar question on the Gallup Korea Omnibus Survey.
.jpg)
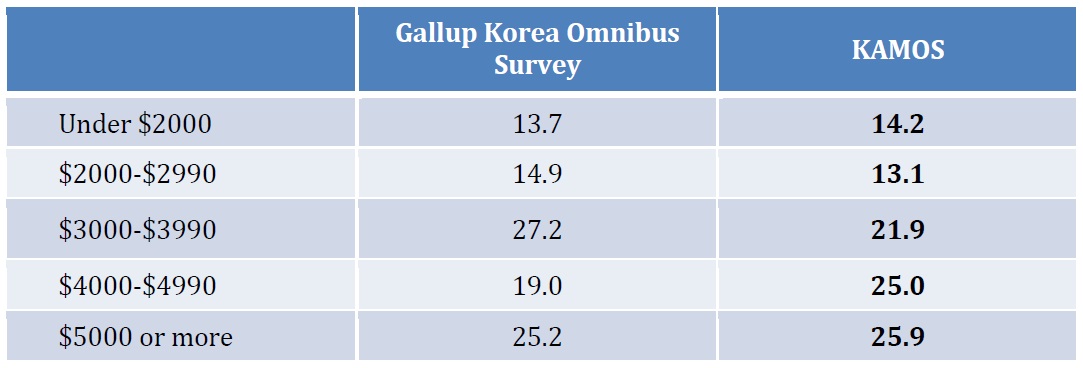
Respondents were also asked about their monthly household income. For the convenience of non-Korean readers, we have indicated the amounts in approximate US dollars instead of South Korean Won. Respondents actually answered in South Korean Won. These approximate money values were calculated by removing the final three zeros from the number. The five income categories that are used in Table 6 are the ones used by the Gallup Korea Omnibus Survey; KAMOS actually included 11 income categories, but some categories were combined here to make the comparison easier to see. The KOSTAT Social Survey does not ask about household income. Our results were comparable to Gallup Korea Omnibus Survey. KAMOS included slightly fewer people in the $3,000-$3990/month category (KAMOS 21.9%; Gallup 27.2%) and slightly more in the $4,000-$4,990/month category (KAMOS 25.0%; Gallup 19.0%), but it is not possible to determine which number is more accurate.

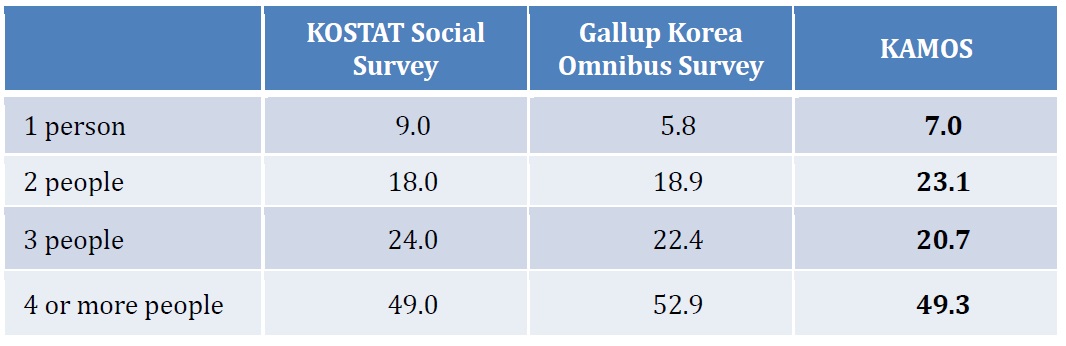
Respondents were asked how many people (including themselves) lived in their household. One-person households are the hardest to reach and are likely to be underrepresented. However, the KAMOS results were comparable to the results of the other surveys, as shown in Table 7.
.jpg)
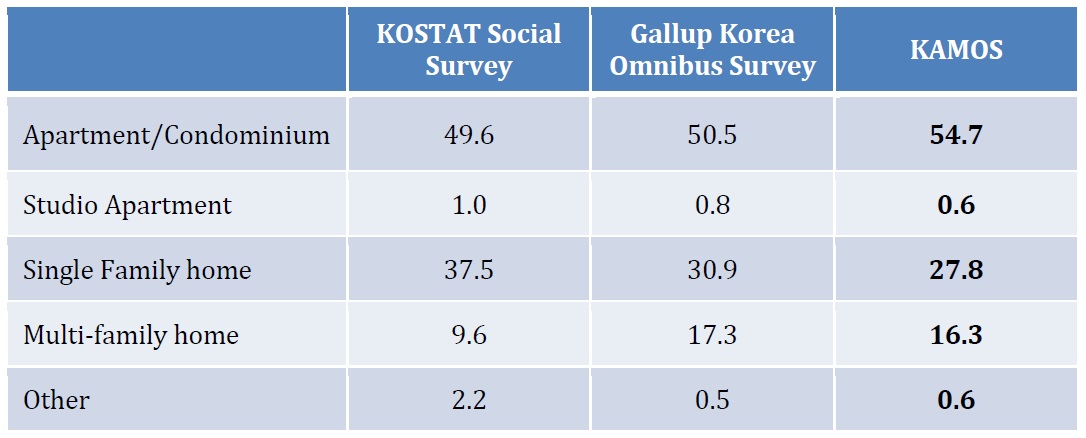
One of the other demographic variables on all three surveys was the type of dwelling. Compared to the other two surveys, KAMOS included slightly more respondents living in apartments or condominiums (KAMOS 54.7%; Gallup 50.5%; KOSTAT 49.6%) and slightly fewer in single-family homes (KAMOS 27.8%; Gallup 30.9%; KOSTAT 37.5%) and multiplex homes (KAMOS 16.3%; KOSTAT 9.6%), as indicated in Table 8. However, since 58% of all housing units are in apartment buildings (Statistics Korea (KOSTAT), 2010), these numbers do not seem far off, and all of the differences between KAMOS and the other surveys were within 10 percentage points.
.jpg)
Overall, the demographic variables from the first KAMOS survey were very similar to the other two surveys. Based on these results, KAMOS seems to be at least as representative as these other respected surveys.
Comparison of the First and Second Survey Results
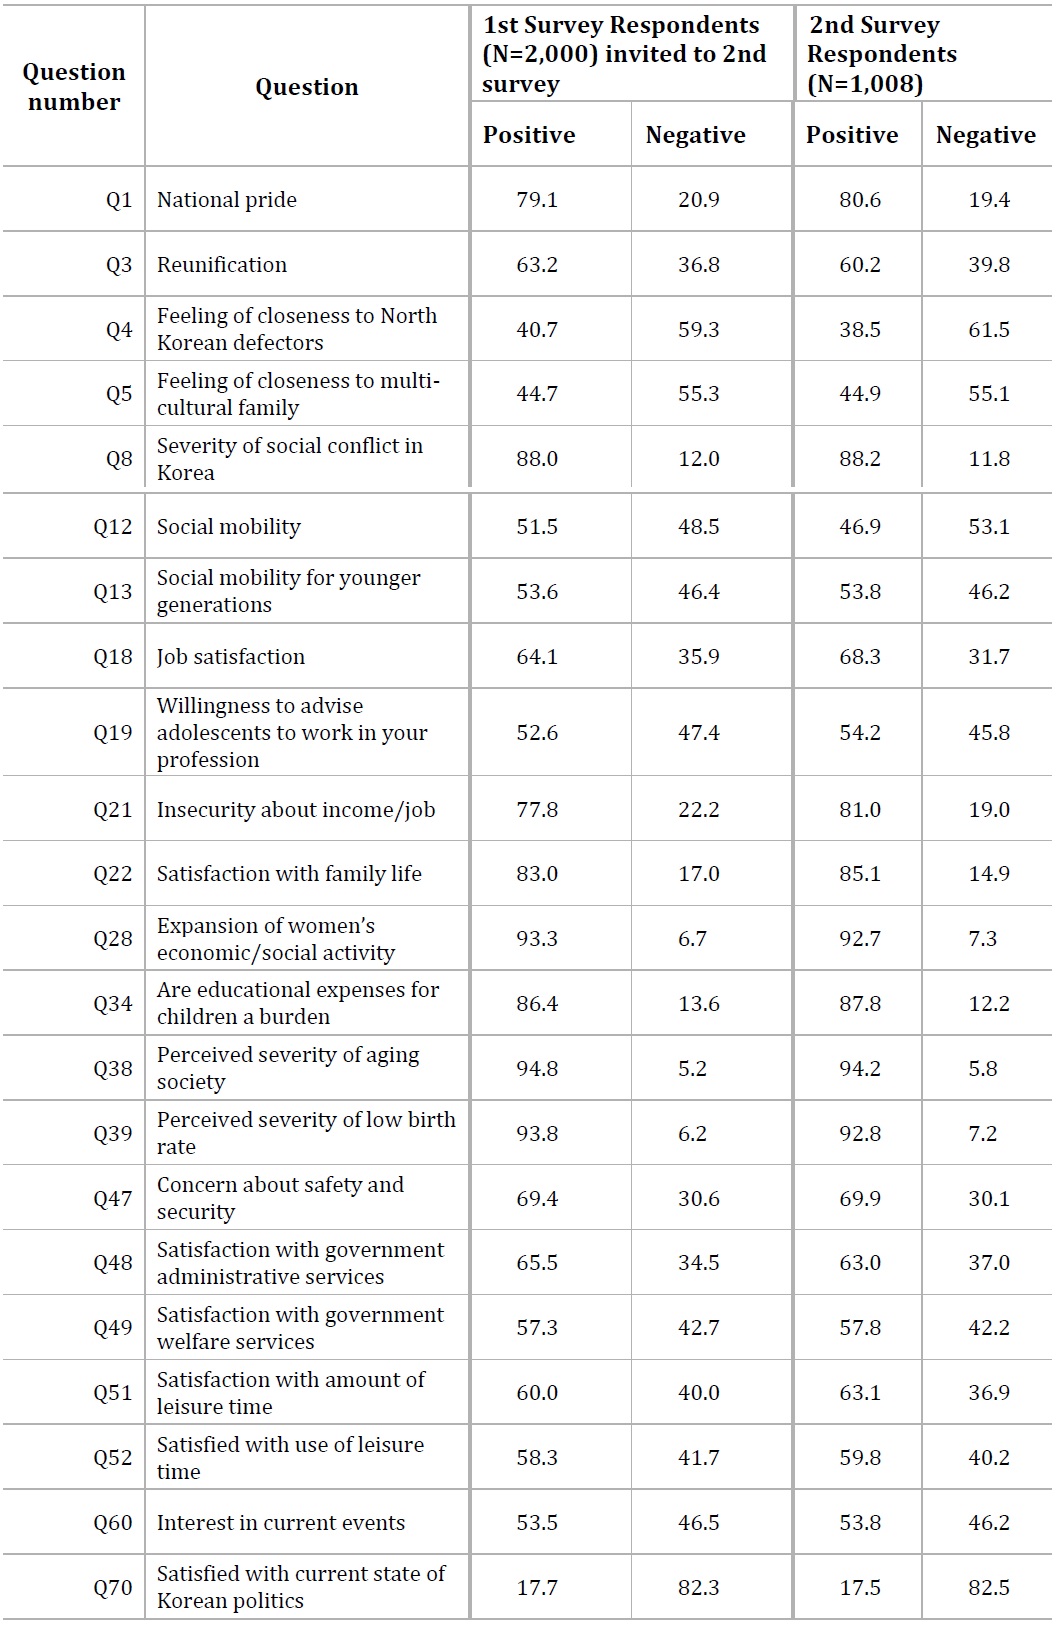
Of the 72 non-demographic items included on the first KAMOS survey, 22 items could be grouped into positive and negative responses (on a 4-point Likert-type scale). By comparing the results of the first survey respondents who were invited to participate in the second survey to the first survey responses of these who responded to the second survey (50.4%), we hoped to determine if there was any substantial difference between those who answered the first survey only and those who answered both surveys.
The differences between the two sets of data were not statistically significant (p<0.05). Of the 22 questions we looked at, only 2 had a difference larger than 4 percentage points. The first of these two questions, Q12 was, “Do you believe that an individual can climb up the socioeconomic ladder if he/she tries hard enough?” The difference was only 4.6 percentage points. However, this small difference was enough to change the results. When all 2,000 respondents are considered, most (51.5%) believed that social mobility was possible. When the responses of only the 1,008 who answered the second survey are considered, the majority (53.1%) did not. This is the only question we looked at where the overall result was reversed.
The second largest difference was on question 18, “All in all, how satisfied would you say you are with your current occupation?” The difference in this case was 4.2 percentage points. More of the respondents to the second survey were satisfied with their job (68.3% compared to 64.1%). In this case, the difference was not enough to change the direction of the results.

Conclusion
Our analysis suggests that KAMOS can be considered representative of the South Korean adult population. The demographic variables of KAMOS respondents/panel recruits matched the demographic variables of respondents to other respected surveys. A comparison between the answers to selected questions from the first survey by those invited to respond and those who actually responded to the second survey showed only small differences, suggesting that the panel remained substantially the same.
Continued monitoring of the KAMOS results will of course be necessary to ensure that it continues to be representative. Like other panels, such as the LISS panel (Blom et al., 2016), we anticipate the need to refresh the KAMOS panel at regular intervals. The current proposed plan is to refresh the panel annually, i.e, every year there will be a face-to-face survey during which new panelists will be recruited to participate in the multimode survey; there will be two additional surveys per year. The schedule may change after the analysis of the third survey or other future surveys. In the meantime, KAMOS is available as a representative survey for scholars interested in the public opinion of South Koreans.
Biographical Notes
Sung Kyum CHO is a professor in the Department of Communication at Chungnam National University and director of the Center for Asian Public Opinion Research & Collaboration Initiative (CAPORCI). He was the first president of the Asian Network for Public Opinion Research (ANPOR). He has also been president of the Korean Association for Survey Research (KASR) and president of the Korean Society for Journalism and Communication Studies (KSJCS). He is part of a team that has just started conducting the Korean Academic Multimode Open Survey (KAMOS). He is also an associate editor and publisher for the Asian Journal for Public Opinion Research (AJPOR).
He can be reached at Chungnam National University, Department of Communication 99, Daehak-ro, Yuseong-gu, Daejeon, 305-764 or by email at skcho@cnu.ac.kr.
Sarah Prusoff LoCASCIO is an associate editor and journal coordinator for the Asian Journal for Public Opinion Research (AJPOR) and researcher at the Center for Asian Public Opinion Research & Collaboration Initiative. She earned her master’s degree from Indiana University in Bloomington, IN, USA and her bachelor’s degree from Bard College at Simon’s Rock in Great Barrington, MA, USA.
She can be reached at Center for Asian Public Opinion Research & Collaboration Initiative, Chungnam National University, Department of Communication 99, Daehak-ro, Yuseong-gu, Daejeon, 305-764 or by email at sprusoff@umail.iu.edu.
Kay-O LEE, PhD, is an advisory professor associated with Gallup Korea. He was formerly a professor of Statistics at the Korea Air Force Academy.
Deok-Hyun JANG is the senior manager of Gallup Korea. His fields of research are election polls and survey methodology including mixed mode design. He earned his MS degree in communication from Korea University, and his doctorate in marketing from Soongsil University.
He can be reached at Research Planning Team, Gallup Korea, 70 Sajik-Ro Jongno-Gu Seoul Korea or by email at dhjang@gallup.co.kr.
Jong Min LEE is a researcher at the Center for Asian Public Opinion Research & Collaboration Initiative.