


According to the 2020 birth statistics from Statistics Korea, the total fertility rate (TFR)[1] of the Republic of Korea (hereafter referred to as Korea) was 0.84 in 2020, the lowest among OECD member countries (35 countries). Korea’s total fertility rate was 2.06 in 1983 (Statistics Korea),[2] which was close to the replacement fertility rate (2.1).[3] The TFR continued to fall to 1.74 in 1984 and 1.46 in 1998. When the TFR fell to 1.08 in 2005, the media and academia at home and abroad raised concerns about the seriousness of such a low fertility rate.
To overcome this low fertility phenomenon, the Korean government established and promoted its 1st Basic Plan (2006-2010) for Low Fertility and Aging Society in 2006. Subsequently, the 2nd (2011-2015) and 3rd (2011-2015) Basic Plans for Low Fertility and Aging Society were drafted in 2010 and 2015 respectively. The 3rd Basic Plan was revised and supplemented in 2018. The 4th Basic Plan (2021-2025) is currently being implemented.
Despite the government’s efforts, the number of births and the TFR in Korea are still declining. Therefore, in order to prepare appropriate countermeasures to overcome the low fertility problem, which is closely related to the development of Korea, it is necessary to conduct a detailed evaluation through empirical analysis of the low fertility countermeasures that have been put into practice so far, and further to provide the results of this evaluation to policy makers.
There are many studies that investigate the effectiveness of Korea’s fertility measures which aim to increase the fertility level by providing incentives to married couples, such as childbirth incentives, child allowances, and parental leave. However, it is difficult to find studies that empirically analyze the effects of available youth jobs on fertility. The 3rd Basic Plan for Low Fertility introduced the youth employment rate (the youth employment rate was 42.4% in 2014 and 48% in 2020),[4] based on Statistics Korea’s Economically Active Population Survey, as the key performance indicator of the youth job policies. Nevertheless, this performance indicator is an output measure, which is not sufficient in measuring the actual outcome of job policy effects on fertility.
In this study, using data from 2011 to 2019, we consider and compare the impact of the policies at two different periods: (1) 2nd Basic Plan (2011-2015) for Low Fertility and Aging Society and (2) 3rd Basic Plan (2016-2020) for Low Fertility and Aging Society, which introduced the youth job measures. Comparing the two time periods, the effectiveness of youth job measures is evaluated. Data for 2020 are not included in this study since the latest data are only available up to 2019. This study examines the interrelationships of youth jobs with marriage and fertility, by using the Employee-Enterprise Linkage DB and the Newlyweds DB from 2011 to 2019 in Korea at the national level.
To interpret the results of this analysis, we also utilized the survey results from KAMOS (Korea Academic Multimode Open Survey) about marriage and fertility. These survey results help us understand why we do not see the direct increase of marriage from the job policy.
Theoretical Background and Literature Review
Lowest-Low Fertility Situation in Korea
The low birth rate problem in Korea is very serious. Korea’s TFR continues to hit new record lows every year. The average TFR of the OECD countries was 1.61 in 2019 while it reached as low as 0.92 in Korea for the same year. Among the OECD countries, Korea is the only country whose TFR plummeted below 1.0.
As of 2020, the TFR of Korea was 0.84, which is similar to the low-fertility variant projection for 2019 (0.81).[5] It is alarming to note that both the TFR and the number of births are rapidly decreasing. In 2020, the number of births in Korea did not exceed 300,000.
Figure 1 shows that Korea’s TFR is less than half of the population replacement level (TFR 2.1). The fact that the TFR in Korea continues to remain below 1 means that Korean society has fallen into a low fertility trap.[6] In particular, former IMF Managing Director Lagarde mentioned Korea’s low birth rate and referred to it as a “collective suicide” (JoongAng Daily, 2017).

It only took about 18 years for Korea to change from an “aging society (7% in 2000) to an aged society (14.3% in 2018). On the other hand, it took 24 years for Japan, 40 years for Germany, 72 years for the United States, and 115 years for France” (Statistics Korea, Population Projection for Korea, 2006, p.45]). The transition from an aged society to a super-aged society is predicted to be in 2025 (20.3% of the total population aged 65 and over). Korea is considered one of the fastest aging societies, which is closely related to declining fertility. This low fertility problem is expected to hinder the future development of Korea. The Korean government is trying to overcome this low fertility problem by establishing a basic plan for a low fertility and aging society and promoting various countermeasures. However, so far, such policy measures have not been successful, and the low fertility problem persists, posing a great threat to sustainable national development.
One of the causes of this low fertility is the decrease in marriages (Figure 2). It can be said that the fertility is decreasing as the number of marriages is decreasing.

Significance of Youth Job Policy
The Third Basic Plan (2016-2020) for Low Fertility and Aging Society, announced by the Korean government in December 2015, identifies youth employment revitalization and housing measures as a high priority. This study will focus on the youth employment revitalization.
The government’s inclusion of “stimulating youth employment” in the measures against low fertility is perceived to be aimed at resolving the socio-economic causes of youth reluctance or rejection of marriage. According to a press release distributed by the Low Fertility and Aging Society Committee (December 2015), “these measures aim to revitalize youth employment by creating a marriage-friendly atmosphere, expand youth jobs through labor reform, and create new jobs in desirable industries.”
Therefore, we interpret the policy purpose of youth job measures is to “provide jobs to young people to create a foundation for marriage, and through this, increase the fertility rate in Korea.” In this study, we discuss the relationship among the youth job, marriage, and fertility from this perspective.
Literature Review
Relationship Between Jobs and Marriages
Previous studies have shown that good job prospects increase the likelihood of marriage. According to Yoo (2016, pp. 17–19), “in both men and women, employed people were more likely to marry than unemployed people. (male: 4.9 times, female: twice), and young people (aged 15-29) are also more likely to marry than unemployed (male: 3.5 times, female: 1.5 times)”. Oh et al. (2016, pp. 228–229) argued, “men who have jobs and higher levels of education are more likely to marry. However, in the case of women, educational levels and marriage did not show a significant relationship. For women, although the employment effect is not as strong as that of men, it appears to have an impact on the likelihood of getting married.”
C.S. Kim (2006) finds that the presence or absence of debt does not have a significant relationship with their intention to marry, but employment status seems to have an effect on the probability of marriage. J. Kim (2013, p. 15) analyzed marriage intentions with family backgrounds, socioeconomic status, and marriage values. He suggests that “employment status is an important factor in marriage performance,” and argues that the “employment rate should be increased in order to increase the marriage and fertility rates.”
Chu and Kim (2018, pp. 82–83) suggest, “If men and women both earn incomes and are regular workers, then they are likely to get married.” They emphasize that there is a great need for “youth policies that put high priority on creating quality jobs for the youth.”
How employment has affected marriage has not been directly studied, but it can be inferred from the findings about how job prospects affect the perception or intention of people on marriage.
The Relationship Between Government Fertility Policy and Childbirth
Some studies show that such fertility measures as tax reduction and various cash incentives seem to have a positive effect on the fertility rate (Ang, 2015; Gauthier & Hatzius, 1997; Kalwij, 2010; Lappegård, 2010; Milligan, 2005; Whittington et al., 1990; Zhang et al., 1994). However, others (Francesconi & Klaauw, 2007; Suk, 2011) argue that these measures did not have significant effects on raising the fertility level. Other measures, such as the expansion of childcare facilities and the adjustment of parents’ working hours, have been shown to increase the fertility rate (Boca, 2002; Higuchi, 1996), and these effects can vary depending on the mother’s education level (Kravdal, 1996).
There is also a study that comprehensively evaluated the effectiveness of Korea’s measures against low birth rates. Lee et al. (2016, pp. 94–143) argues that the government’s birth measures, such as childbirth incentives, the number of childcare facilities, childcare support, and childcare allowance, have a positive effect on improving the fertility rate.
Choi and Lee (2017, p. 208) argue that “support for childcare and education services, support for creating work-family compatibility conditions, and other childbirth encouragements have a positive effect on the increase in the number of births.”
The Relationship Between Youth Jobs with Marriage and Childbirth
Y. Kim (2016) conducted a study on how the wages of young people affect the probability of marriage. Kim shows that, for men, there is a positive correlation between wage levels and marriage probability and, for women, the probability of marriage is the highest for low-wage classes and the lowest for middle-wage classes.
D.H. Kim et al. (2019, pp. 38–39) propose two types of feedback loops that link low birth rates and job policies. “First, the pessimistic outlook suggests that low birth rates worsen economic growth, reduce jobs, and eventually lower the fertility rate of young people who do not have jobs. Second, the optimistic scenario alludes that if the low birth rate continues, the working population will decrease, which will eventually lead to a decrease in the unemployment rate and eventually increase the fertility rate.” Jung et al. (2019, p. 60) also argue, “if the fertility rate decreases, the working population decreases, eventually leading to a decrease in the unemployment rate, which in turn increases the fertility rate.” They conclude this negative feedback loop has the function of restoring the system.
Y. Kim (2016, p. 18) points out that the existing low birth rate measures are mainly aimed at married couples, saying, “So far, the low birth rate measures have focused on supporting the childbirth and parenting of married women.” However, he argues that if it is not possible to provide young people with a “stable and appropriate wage job” to get married and raise a family and children, the low birth rate policy may prove ineffective. In order to secure the effectiveness of the low birth rate countermeasures, Kim’s argument that the main targets of the low birth rate countermeasure should be young people rather than married couples is quite valid.
Summarizing the results of previous studies, we can see that employment has a positive effect on marriage intention, and the creation of various allowances and services related to childbirth and childcare have a positive effect on the fertility rate. In addition, it can be said that not only the childbirth support policies for married people but also the low birth rate policies through stable job support for young people are very important, when considering the effect of employment on childbirth through marriage.
However, we could not know the effect size of job policy, though some studies showed the effect of government policy. So, we cannot tell if job policy has a big effect enough to reverse the trend or not.
As of 2020, 97.4% of all births in Korea were during marriage (Statistics Korea, n.d.-e), and in the case of Korea, childbirth tends to be subordinated to marriage. In addition, as shown in Table 1, although the average number of births among married women in Korea has continued to decline since 2005, the average number of births among married women is still greater than 2.[7] Moreover, in the case of married women aged 15 to 49, the average number of births is greater than 1. In addition, as shown in Figure 3, the timing of marriage and childbirth is delayed and continuously decreasing, but we can observe that there is a positive relationship between the number of marriages and births.
.png)
The effect of job policy has been suggested as the basis for public opinion surveys. There has been little research regarding whether job policy actually affects birth rate and marriage.
Research Methodology
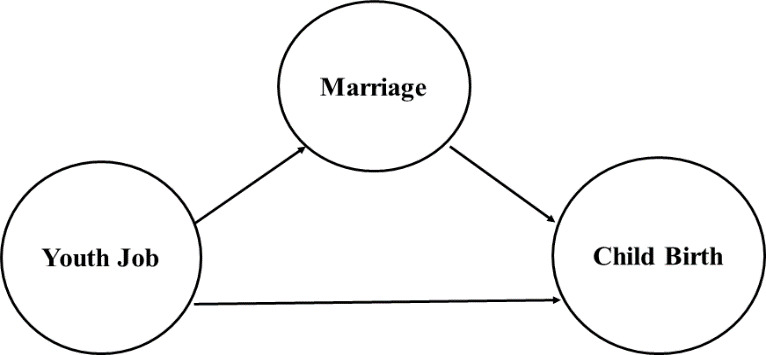
Job, marriage, and childbirth were selected as variables for evaluating the effectiveness of the government’s job measures. Following Vedung’s (2003) goal achievement evaluation model, we examine the relationship of the youth job → marriage → childbirth.
To evaluate the effectiveness of jobs on marriage and childbirth, first, we assess the effect of an increase in number of jobs on marriages. We also attempt to observe whether an increase in marriages leads to an increase in births, and to determine the direct effect of increase in jobs on births.
Target Population
In order to evaluate the effectiveness of job measures on marriage and childbirth, young people[8] who have held jobs over the past nine years (2011-2019) and their marriage and childbirth behavioral patterns are the subject of this study.
Conceptual Definition
The jobs under the government’s low fertility countermeasures include only regular and temporary workers among the job positions provided to young people by businesses (including government, corporations, individual businesses, etc.).
Marriage is defined as a legal marriage in which one man and one woman promise to live together and register their marriage according to the current law of Korea. The total fertility rate (TFR) is the average number of children a woman has during her reproductive period (aged 15-49), and childbirth is considered to be the birth of a child alive in a legally married family.
Variables
The independent variables (X) are youth jobs and marriage. The dependent variable (Y) is childbirth. The first independent variable (X1), a measurement indicator for youth jobs, is the number of young people occupying jobs and their proportion among all young people. The second independent variable (X2), a measurement indicator for marriage, represents the number of married people, the marriage rate, and the proportion of job occupants among married young people.
The dependent variable (Y), which is a measurement indicator for fertility, includes the average number of births and the proportion of births.
Research Model
The effectiveness of job policy measures is assessed by calculating the number and proportion of job occupiers among all young Koreans, the number of marriages, the marriage rate, the proportion of job occupiers who are married, and the average number and proportion of births. The effectiveness of the job policy measures is determined by comparing the impact before (2011-2015) and after (2016-2019) the implementation of the job policy measures. The general scheme of this research model is shown in Figure 4 below.
Data Source and Analytical Methods
The youth job data in this study are from the Statistics Korea’s Employee-Enterprise Linkage DB (hereinafter referred to as the Employee DB) from 2011 to 2019. The Employee DB[9] provides information related to individuals’ jobs by integrating social insurance and tax data from the National Tax Service.
Marriage and childbirth data are extracted from the Statistics Korea’s Newlyweds DB[10] which are administrative data for couples who have reported marriage within the past five years as of November 1 every year. Each personal record is exactly matched using the unique number assigned to each individual. For young people aged 15-34 in the linked data (hereinafter referred to as the integrated DB), the total number of regular and temporary job occupants, the total number of married people, and the total number of births within 5 years of marriage are compiled for further analysis. If there is a difference in the reference time points in each DB, it was estimated using methods such as ratio[11] estimation. Based on the statistics DB for newlyweds, the linkage rate between the Employee DB and the Newlyweds DB is about 68%. For data analysis, the population projections aged 15 to 34 from 2011 to 2019, the number of marriages aged 15 to 34, the total number of marriages, and the marriages and births in vital statistics are also used. These data can be accessed from Statistics Korea’s KOSIS (Korea Statistical Information Service).
We use linear spline regression and simple regression models to determine the effectiveness of the youth job countermeasure by comparing the relationship of job → marriage → childbirth before and after the implementation of the youth job countermeasures.
Results
The Effectiveness of Job Policy Measures: Did the Number of Jobs Increase?
As shown in Figure 5, the proportion of young people occupying jobs[12] increases every year, and the increase is found to be somewhat larger starting from 2016. In order to confirm this substantial increase starting from 2016, we use linear spline regression models used by James et al. (2013).

Linear spline regression with K number of knots is a piecewise linear polynomial regression that is continuous in each knot, expressed by the equation below.
\[y_{i} = \beta_{0} + \beta_{1}b_{1}\left( x_{i} \right) + \beta_{2}b_{2}\left( x_{i} \right) + \cdots + \beta_{K}b_{K}\left( x_{i} \right) + \varepsilon_{i}.\]
In the model above, represent basic functions. The linear spline regression model is built in which the regression coefficient changes from 2016 and has 1 knot (k=1). The basic function and linear spline regression model are as follows.
\[y_{i} = \beta_{0} + \beta_{1}b_{1}\left( x_{i} \right) + \beta_{2}b_{2}\left( x_{i} \right) + \varepsilon_{i},\]
in which and are basic functions and represents a knot.
As a result of analyzing the change in the proportion of youth occupying jobs during the 2011-2019 period using the linear spline regression model, we can observe that linear spline regression model’s R2 (0.992) is slightly higher, as shown in Figure 5, when compared to R2 (0.973) from the linear regression model.
While the proportion of youth occupying jobs is on the rise from 2011 to 2019 as shown in Figure 5, the results of linear spline regression analysis in Figure 5 show that the proportion of youth occupying jobs increased by 0.65% annually until 2015 and increased by 1.1% starting from 2016.
Considering that the slope changes before and after the government implemented job growth measures, it suggests that there have been more jobs since the implementation of job measures. This supports the positive effect of the youth job measures implemented in 2016.
The Relationship Between Youth Jobs and Marriage
Next, in order to find the relationship between youth jobs and marriage, the following rates are calculated and compared: the marriage rate of all young people from 2011 to 2019 (hereinafter referred to as the “marriage rate of all young people”[13]), the marriage ratio of young people who occupy jobs (regular and temporary) (hereinafter referred to as “the marriage rate of young people occupying jobs”[14]), and “the proportion of job occupants among married young people.”[15]
Figure 6 suggests that the marriage rate of all young people shows a steady decline and this trend accelerated around 2015. We use the linear spline regression model to examine this changing trend of marriage rate among young people. The result of performing a linear spline regression analysis as demonstrated in Figure 6, shows that the marriage rate of all young people decreased by 0.095% before 2015 but decreased by 0.171% after 2015. The decrease was slightly greater after 2015.

The marriage rate of young people occupying jobs is checked to determine if the decrease in marriage rate is attributable to whether or not they occupy jobs. As shown in Figure 7, the marriage rate of young people occupying jobs shows a continuous decline, and similar to the marriage rate of all young people, the decrease appears to increase slightly from 2015. To confirm this decreasing trend, linear spline regression analysis is performed. The results ) demonstrate that, as shown in Figure 7, the marriage rate of young people occupying jobs decreased by 0.11%p per year before 2015, but 0.32%p after 2016. It can be seen that the magnitude of the decrease is widened after 2016.

Summarizing the results of the two previous analyses, both the marriage rate of all young people and the marriage rate of young people occupying jobs continue to decline steadily, while the decrease in the marriage rate of young people occupying jobs is greater. This declining trend is more marked as of 2015, indicating that the increase in the youth job share and the decrease in the marriage rate have been faster since 2016, respectively.
In order to further understand the impact of jobs on marriage amid the overall delay in marriage of young people, we looked at the proportion of job occupants among married young people. As shown in Figure 8, although the proportion of job occupants among married young people continues to rise, the magnitude of this increase starts to diminish from 2016.

To examine whether such a change in the scale of increase is associated with the increase in the proportion of youth occupying jobs, we fit a linear spline regression model as shown in Figure 8. The proportion of youth occupying jobs is an independent variable and the proportion of job occupants among married young people is a dependent variable. From the results of the linear spline regression analysis, we can observe that until 2015 (proportion of youth occupying jobs = 44.8%, Figure 5), when the proportion of youth occupying jobs increased by 1%p, the proportion of job occupants among married young people increased by about 2.13%p, but the increase declined to 0.38%p from 2016. This means that although youth jobs have a positive effect on marriage among young people, the influence has been declining since 2016.
The results of this study suggest that youth jobs have a positive effect on marriage among young people, but they did not have a greater effect compared to the period before the implementation of the job policy measures (2011-2015).
As mentioned above, youth job policy measures are promoted to spur marriage and childbirth. As a consequence, the number of jobs increased but the number of marriages did not.
The Relationship Between Marriage and Childbirth of Young People
In order to examine the relationship between marriage and childbirth, a linear spline regression analysis is performed by using the marriage rate of all young people, the average number of births among married young people,[16] the marriage rate of youth occupying jobs and the average number of births for job occupants among married young people.[17]
The results (Figure 9) show that there is no significant change between the period before (2011-2015) and after (2016-2019) the implementation of the job policy measures. Accordingly, a simple regression analysis is performed to identify the relationship between the variables. The simple regression model shows that a 1% increase in the marriage rate of young people increases the average number of births by 0.13, and a 1% increase in the marriage rate of youth occupying jobs increases the average number of births by 0.05.

Based on the results of the above analysis, although there is no significant change in the marriage rate and the fertility rate before and after the implementation of the job policy measures, the fertility rate seems to increase slightly as the marriage rate increases.
However, the effect of marriage among young people on childbirth does not seem to have a greater effect on the TFR compared with the period before the job policy measures (2011-2015) were implemented.
The Relationship Between Youth Job and Childbirth
As shown in Figure 3, both the crude marriage rate and the TFR indicate a decreasing trend. The total youth marriage rate (3.5% in 2011 → 2.4% in 2019) and the fertility rate are also decreasing (total fertility rate: 1.24 in 2011 → 0.92 in 2019, Statistics Korea Vital Statistics-Birth Statistics). In order to understand the effect of youth jobs on childbirth, this study calculates the proportion of births among young people[18] and the proportion of births among young people occupying jobs.[19]
In this case, the births of all young people (aged 15-34) refer to those whose mother’s age is 15-34 years old. The births of young people occupying jobs include cases where either mother or father is aged 15-34. This difference in the birth definition stems from using multiple sources of data (Vital Statistics and Integrated DB). To be more precise, vital statistics do not publish birth statistics for the age of parents. In this study, considering that men have a higher marital age than women (33.23 years for men and 30.78 years for women, as of 2020 according to KOSIS), births based on maternal age are used. Therefore, it is necessary to consider this difference when we are interpreting the proportion of births among youths occupying jobs.
As shown in Figure 10, while the proportion of births among all young people is on the decline, the proportion of births among youths occupying jobs has been on the rise since 2015. In order to examine whether this increasing trend is related to the increase in the proportion of youths occupying jobs, as shown in Figure 11, the linear spline regression analysis is performed. The proportion of youths occupying jobs is the independent variable and the proportion of births among youths occupying jobs is the dependent variable in the regression model.


From the results of the linear spline regression analysis, we can observe that until 2015 (proportion of youth occupying jobs = 44.8%), when the proportion of youth occupying jobs increased by 1%p, the proportion of births among youths occupying jobs increased by about 0.34%p. However, it should be noted this increase amplified to 1.28%p from 2016. This means that youth jobs are having a positive impact on the fertility of young people, and at the same time, their influence has been expanding from 2016.
In short, if the number of young people occupying jobs increases, fertility of these people also increases. The impact of youth employment on childbirth was found to be greater after (2016-2019) than before (2011-2015) the job policy measures are implemented.
Evaluation of the Effectiveness of Employment Policy Measures
From what we have seen so far, jobs have increased since 2016, which can be said to be the effect of the government’s youth job policy measures.
Meanwhile, regarding the relationship between youth jobs and marriage, we find that the marriage rate of young people is lower after the implementation of the job policy measures (2016-2019) than before (2011-2015). Looking at the results alone, it is difficult to conclude that the increase in the number of youth jobs leads to the increase in marriages of young people.
However, these results seem to be more related to the recent sharp decline in the number of marriages and fertility rates. The fact that the proportion of job occupants among married young people continues to increase can be seen as evidence that jobs are holding back the further decline in marriage and fertility among young people.
According to the surveys from KAMOS (the Korean Academic Multimode Open Survey), job and financial status seem to be primary factors for marriage. The 2019 survey result showed that the intention to marry among young people is closely related to their incomes. Though the youth’s intention to marry went down from 78.7% (2018) to 68.7% (2019), those who had incomes of more than 3 million Won (about 2,500 US dollars) a month were more willing to marry than young people whose income was less than 3 million Won a month. As to the intention to have a baby, the 2019 survey results showed a decline from 73.5% (2018) to 62.9% (2019), and the time of childbirth seemed to be delayed as shown in Table 2 (Cho et al., 2019). These survey results from KAMOS seemed to support the above results of this study.
Regarding marriage and childbirth among young people, we found that as the number of marriages among young people increased, fertility also increased. However, as in the relationship between jobs and marriage, the effect of the increase in youth marriage on fertility is not greater after (2016-2019) than before (2011-2015) the youth job policy measures were implemented.
Lastly, regarding the relationship between jobs and fertility, when the number of young people occupying jobs increases, fertility also increases. In addition, unlike the relationship between marriage and childbirth, the effect of youth jobs on childbirth seems to have a greater impact after (2016-2019) than before (2011-2015) the youth job policy measures are implemented.
Based on the results of this study, it is interesting to note that marriage does not increase in proportion to the increase in jobs. However, the trends of proportion of job occupants among married young people and job growth seem to move in a similar direction. In addition, as marriage increases, the number of births increases, and although the fertility rate of all young people shows a decreasing trend, the fertility rate of young people occupying jobs shows an increasing trend after the implementation of the youth job policy measures. In other words, although job growth among young people does not lead to an increase in marriage, the number of births increases significantly when young people who occupy jobs get married.
The results of this study suggest that youth jobs may not be a sufficient condition for marriage and childbirth, but it is a necessary condition. This means that job policies may not have an effect in the short term but may have an effect in the long term. The results also suggest that youth jobs have a greater impact on childbirth after the implementation of the job policy measures than before. Therefore, it is important to foster necessary conditions for marriage through stable youth jobs so that such effects can lead to an increase in fertility.
Conclusion
So far, the assessment of the Korean government’s policies to reduce low fertility problems have been focusing on incentives provided to married couples, such as childbirth incentives, child allowances, and parental leaves. To our knowledge, it is rare to find a study that empirically analyzes the effects of youth jobs on fertility.
In this study, we empirically analyze the effects of youth job policy measures, one of the Korean government’s policy measures, aimed at overcoming the low fertility rate, on marriage and fertility among young people. As a result, we find that there is a need for a paradigm shift in current countermeasures against low fertility, provided mainly for married couples, such as maternity subsidies, parental leave, maternity leave, childcare allowances, etc. One of the most important factors in Korea’s low fertility problem is that young people simply do not get married. When young people get married, we can expect that on average they will have two or more children though the timing of childbirth is being gradually delayed. The TFR of Korea is much lower than this general expectation. Therefore, it is necessary to change the direction of Korea’s fertility measures from the existing married couple-centered childbirth support policy to a policy that encourages young people to marry, and to create an environment where they can get married. In this study, we utilized the actual behavior data (Employee-Enterprise Linkage DB and the Newlyweds DB) and also used the opinion studies to interpret the behaviors of the youth, unlike previous studies.
However, this study also has limitations. The youth jobs analyzed in this study does not distinguish between jobs created by the job policy measures and those jobs created regardless of the job policy measures due to the limitations of data available. Instead, after analyzing the change on total youth jobs before and after the implementation of the measures, the difference was attributed to the effect of the youth job policy measures. In addition, daily or special employment jobs are excluded from the study.
Therefore, in order to further improve the quality of this study and effectively realize the countermeasures against the low birth rate in Korea, daily or special employment jobs should be included in the Employee DB in the future. More in-depth research is needed to understand the multidimensional aspects of the postponement and the decline of marriage and childbirth among young people. Through these research findings, effective policy support should be provided to create a conducive environment for marriage and childbirth for unmarried young people. In addition, the analytical methods adopted in this paper can also be applied to other low fertility measures (e.g., childbirth incentives, paid leave grants, tax reductions, etc.) that are not covered in this study. Studies that focus on monitoring the impact of low fertility measures are important barometers of assessing the government’s policy. We expect the method used in this paper to contribute to further research on this topic in the future.
“Total Fertility Rate is the average number of children that a woman is expected to have during her reproductive years (aged 15-49). Completed Fertility Rate is the total number of children women in the same birth cohort will have until the end of their fertility period.” (Statistic Korea. 2011, adapted from Encyclopedia of Population, 809).
Accessed from Statistics Korea KOSIS/Domestic Statistics/Thematic Statistics/Population/Vital Statistics/Birth/Number of births, Total Fertility Rate, Natural Increase (1970-2020).
According to Seulki Choi (2015, p. 17) “Replacement fertility rate is the level of fertility at which the population of a society remains constant without increasing or decreasing. In general, the total fertility rate of 2.1 is called the replacement fertility rate.”
The target of the youth employment rate was shown in Press Releases of the Committee on Low Fertility and Aging Society 2015.12.10. 39. (Reference 2: Core Performance Indicators of Basic Plan).
The population projections released by Statistics Korea include 3 scenarios: most optimistic scenario (high-fertility variant), the most pessimistic scenario (low-fertility variant), and the medium-fertility variant. As of 2019, the high-fertility variant projection is 1.06 and the medium-fertility variant projection is 0.90.
“The Low Fertility Trap is a theory created by Lutz of Austria in 2006 to explain the phenomenon of ultra-low birth rates in Europe, Japan and Korea. According to this theory, a society has fallen into a low fertility trap if the number of childbearing women and births decreases (demographic aspects); if the ideal number of children for married couples is declining (social aspects); and if the expected future income does not keep up with the consumption level of young people (economic aspects)” (Naver Dictionary). According to Dong-wook Eom (2009), Lutz, Skirbek, and Testa (LST) suggest that a vicious cycle of low birth rate (low fertility trap) is achieved through three paths, such as demographic, social, and economic paths.
Statistics Korea KOSIS/Domestic Statistics/Thematic Statistics/Population/Population Census/Population Sector/Population by Census (2015~)/Sample (20%)/Women·Children/births by age by married women for year 2005, 2010, 2015, 2020. Average number of births is rounded two decimal places.
According to Article 2 of the Special Act on the promotion of youth employment, youths are considered to be those aged 15 to 34.
The Employee DB uses five types of social insurance data (national health insurance subscribers, employment insurance insured and disqualified, employment insurance daily work history verification, industrial accident insurance special type, work employment/separation data), three types of original data form the National Tax Service (employment income statement, business income statement, daily worker income statement), and the Statistical Business Register to build information related to the employment status of individuals in Korea.
Newlyweds statistics were first released in 2015, and the coverage is 5 years. The reference date is November 1 of every year, and it includes married couples whose marriage duration is less than 5 years. The 2015 Newlyweds DB includes newlyweds from 2011 to 2015.
Proportion of young people occupying jobs
The marriage rate of all young people
The marriage rate of young people occupying jobs
The proportion of job occupants among married young
The average number of births among married young people
The average number of births for job occupants among married young people
Proportion of births among young people
Proportion of births among young people occupying jobs
* The births of young people occupying jobs include birth cases where either mother or father is aged 15-34.